外研版(2019)必修第二册Unit3-On the move阅读+语言点课件(26张)
文档属性
| 名称 | 外研版(2019)必修第二册Unit3-On the move阅读+语言点课件(26张) |

|
|
| 格式 | zip | ||
| 文件大小 | 3.6MB | ||
| 资源类型 | 教案 | ||
| 版本资源 | 外研版(2019) | ||
| 科目 | 英语 | ||
| 更新时间 | 2022-03-10 00:00:00 | ||
图片预览


文档简介
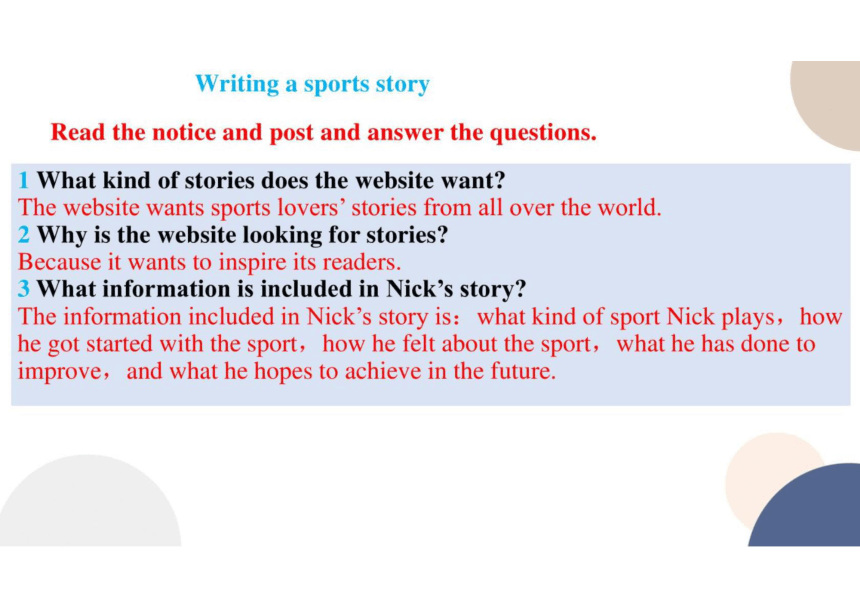
(共26张PPT)
UNIT 3 On the move
Developing ideas Presenting ideas
Developing ideas
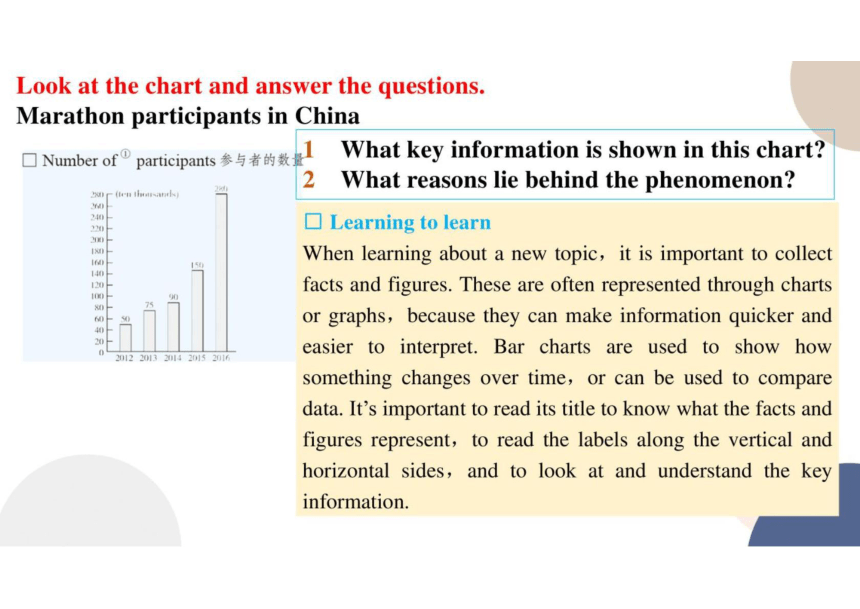
Look at the chart and answer the questions.
Marathon participants in China
Number of
participants参与者的数l
What key information is shown in this chart
2
What reasons lie behind the phenomenon
2x0 (teu thousands)
)
240
20
Learning to learn
2
160
When learning about a new topic,it is important to collect
140
120
1
facts and figures.These are often represented through charts
80
6
or graphs,because they can make information quicker and
0
20
0
easier to interpret.Bar charts are used to show how
20122013
201420152016
something changes over time,or can be used to compare
data.It's important to read its title to know what the facts and
figures represent,to read the labels along the vertical and
horizontal sides,and to look at and understand the key
information.
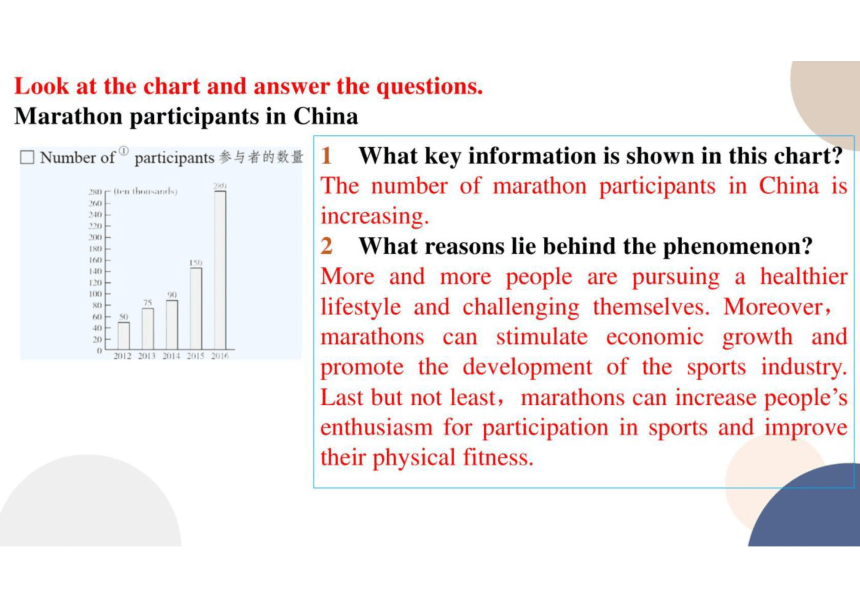
Look at the chart and answer the questions.
Marathon participants in China
Number of participants参与者的数量
1 What key information is shown in this chart
280
The number of marathon participants in China is
20
increasing.
2)
IxO
160
2 What reasons lie behind the phenomenon
0
More and more people are pursuing a healthier
6
lifestyle and challenging themselves.Moreover,
0
marathons can stimulate economic growth and
20122013
201420152016
promote the development of the sports industry.
Last but not least,marathons can increase people's
enthusiasm for participation in sports and improve
their physical fitness.
UNIT 3 On the move
Developing ideas Presenting ideas
Developing ideas
Look at the chart and answer the questions.
Marathon participants in China
Number of
participants参与者的数l
What key information is shown in this chart
2
What reasons lie behind the phenomenon
2x0 (teu thousands)
)
240
20
Learning to learn
2
160
When learning about a new topic,it is important to collect
140
120
1
facts and figures.These are often represented through charts
80
6
or graphs,because they can make information quicker and
0
20
0
easier to interpret.Bar charts are used to show how
20122013
201420152016
something changes over time,or can be used to compare
data.It's important to read its title to know what the facts and
figures represent,to read the labels along the vertical and
horizontal sides,and to look at and understand the key
information.
Look at the chart and answer the questions.
Marathon participants in China
Number of participants参与者的数量
1 What key information is shown in this chart
280
The number of marathon participants in China is
20
increasing.
2)
IxO
160
2 What reasons lie behind the phenomenon
0
More and more people are pursuing a healthier
6
lifestyle and challenging themselves.Moreover,
0
marathons can stimulate economic growth and
20122013
201420152016
promote the development of the sports industry.
Last but not least,marathons can increase people's
enthusiasm for participation in sports and improve
their physical fitness.