【核心素养目标】Unit 2 Numbers Period 4 Writing 课件
文档属性
| 名称 | 【核心素养目标】Unit 2 Numbers Period 4 Writing 课件 |

|
|
| 格式 | pptx | ||
| 文件大小 | 3.3MB | ||
| 资源类型 | 试卷 | ||
| 版本资源 | 牛津深圳版 | ||
| 科目 | 英语 | ||
| 更新时间 | 2022-08-22 00:00:00 | ||
图片预览

文档简介
(共41张PPT)
Unit 2 Numbers
Period 4 Writing
牛津深圳·广州版八年级上册
Learning objectives
1.Knowledge objectives:
① Master the key words such as traffic and accident.
② Students understand what line chart is and the purpose of using line chart.
2.Skill objectives:
① Students can describe the changes of data in the graph with appropriate words according to the graph.
② Through the analysis of the structure and data of graphics, students can know the information about the changes of graphics data.
③ Read the data changes in the graph and complete a report reflecting the changes in the number of traffic accidents in different months.
④ According to the changes in the data in the graph, write a report reflecting the changes in the number of junior high school students in different years.
Learning objectives
3.Emotional objectives:
① Cultivate students' team work ability, and students can correct other students' compositions.
② Through learning how to use the numbers in the analysis chart, students' interest in mathematics can be improved.
4.Thinking capacity:
Cultivate students' independent thinking ability, improve their thinking ability, and be able to objectively judge and analyze data, improve their own innovative thinking, and express independent opinions.
Lead in
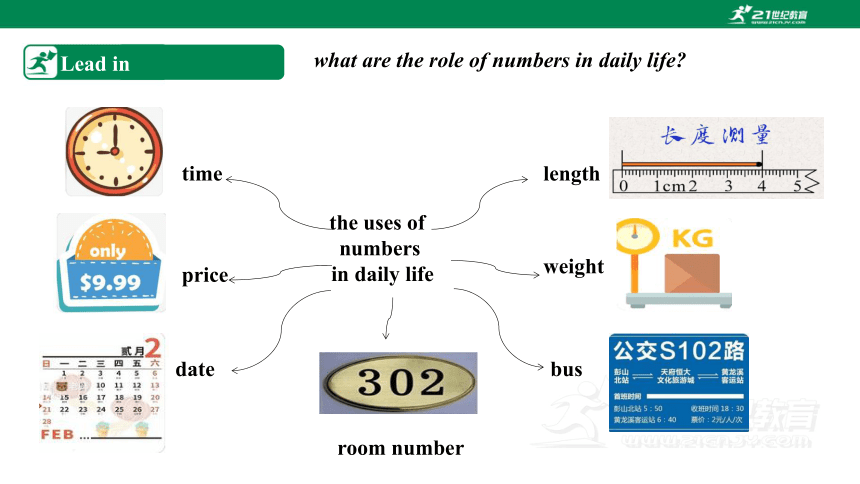
what are the role of numbers in daily life
price
time
length
weight
date
room number
bus
the uses of
numbers
in daily life
Student A:What do we use numbers for
Student B: We use numbers to analyze many numbers.
Student A:Why should we analyze the figures
Student B:Because I can find problems and try to solve them.
(We can understand how things change.
It can help us understand the world better.)
分组角色扮演讨论
1.同学两人一组,进行对话练习。
2.角色对换,进行对话练习。
3.下列句型可能对你有所帮助。
What do we use numbers for
We use numbers to analyze many numbers.
We use numbers to analyze...
Role play
Presentation
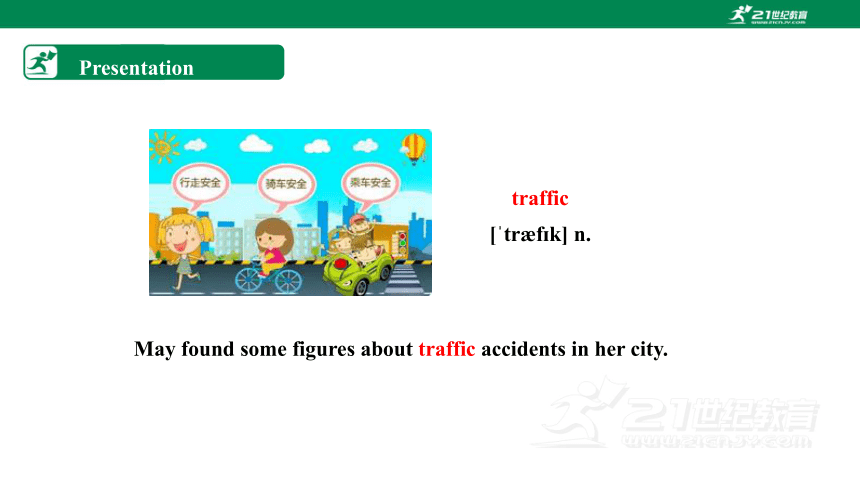
traffic
[ tr f k] n.
May found some figures about traffic accidents in her city.
Presentation
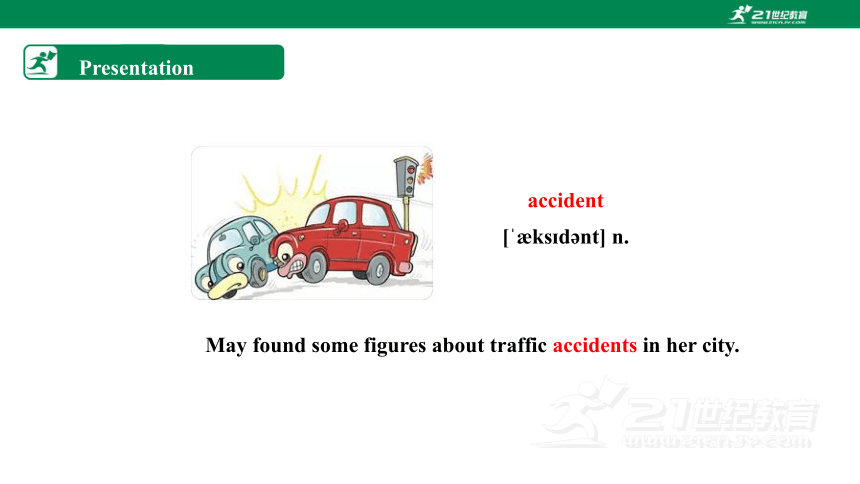
accident [ ks d nt] n.
May found some figures about traffic accidents in her city.
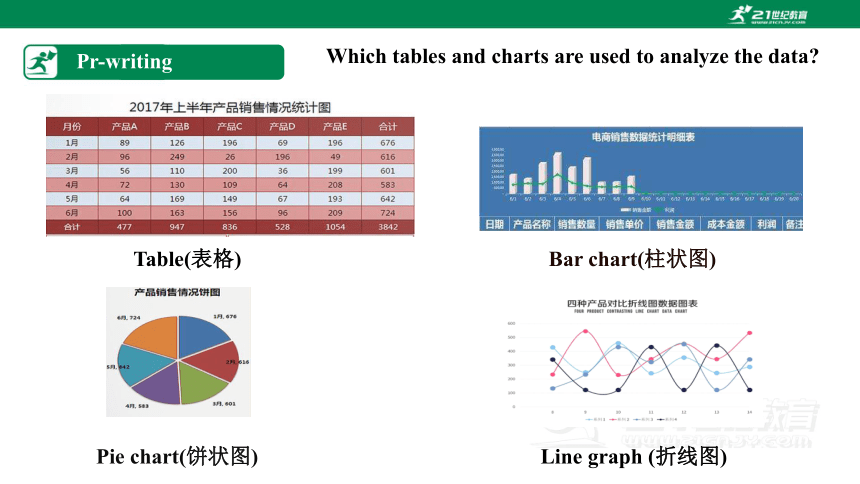
Which tables and charts are used to analyze the data
Table(表格)
Bar chart(柱状图)
Pie chart(饼状图)
Line graph (折线图)
Pr-writing
Grammar
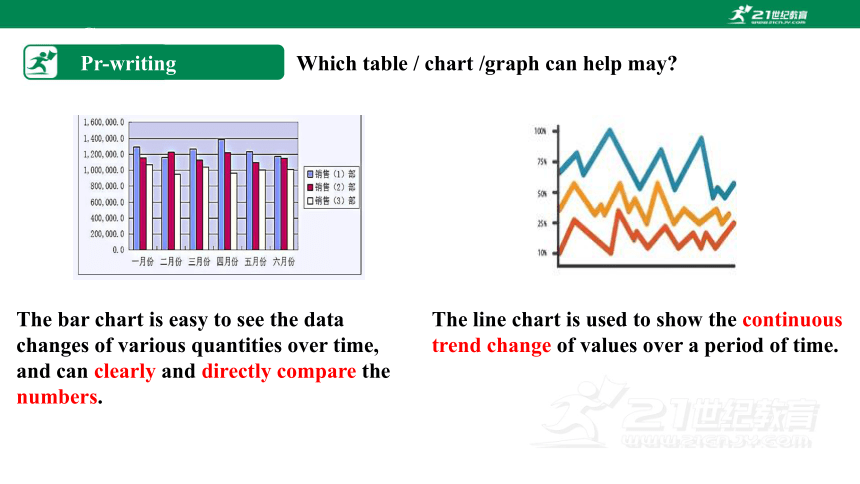
Which table / chart /graph can help may
Pr-writing
The bar chart is easy to see the data changes of various quantities over time, and can clearly and directly compare the numbers.
The line chart is used to show the continuous trend change of values over a period of time.
Grammar
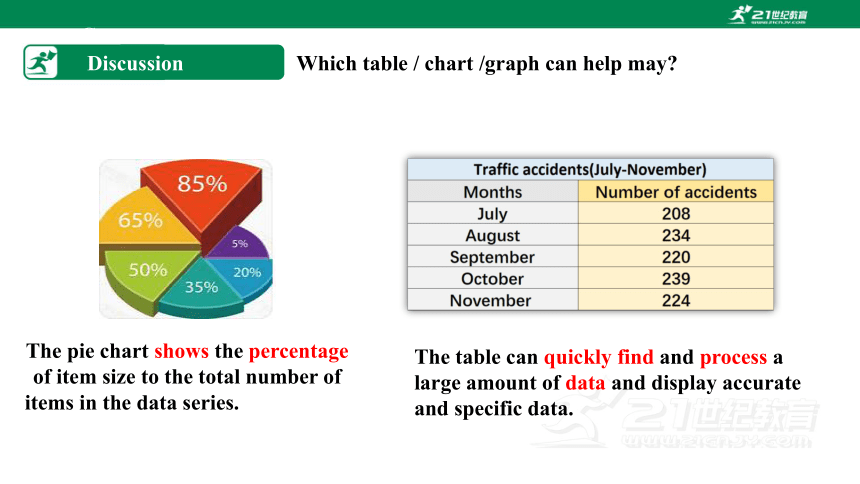
Discussion
Which table / chart /graph can help may
The pie chart shows the percentage of item size to the total number of
items in the data series.
The table can quickly find and process a
large amount of data and display accurate
and specific data.
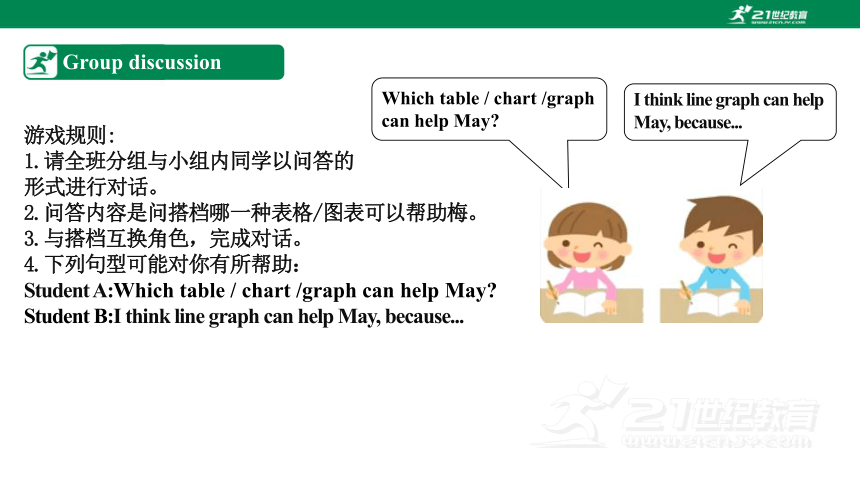
游戏规则:
1.请全班分组与小组内同学以问答的
形式进行对话。
2.问答内容是问搭档哪一种表格/图表可以帮助梅。
3.与搭档互换角色,完成对话。
4.下列句型可能对你有所帮助:
Student A:Which table / chart /graph can help May
Student B:I think line graph can help May, because...
Group discussion
Which table / chart /graph can help May
I think line graph can help May, because...
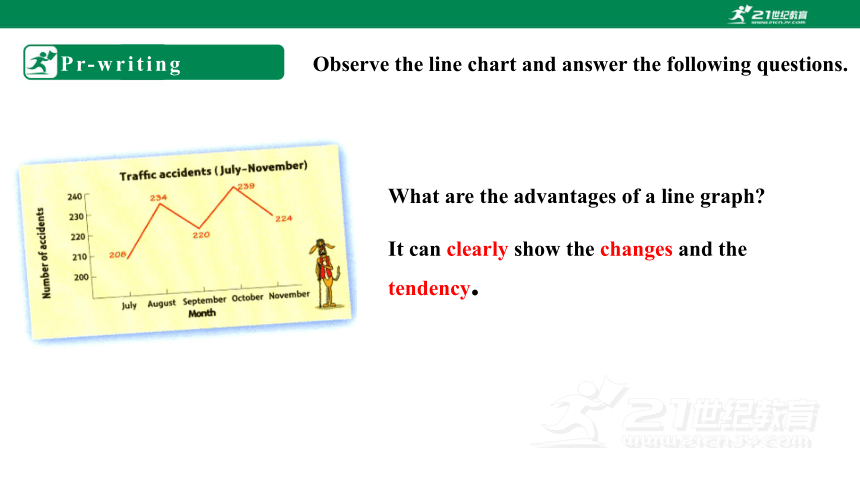
Pr-writing
What are the advantages of a line graph
It can clearly show the changes and the tendency.
Observe the line chart and answer the following questions.
Grammar
Writing
A May found some figures about traffic accidents in her city. She drew a line graph and wrote a plete the report below.
A report with numbers
Write the numbers in
figures, not in words.
Top tip
Exercises
1.What's the line graph about
2.What do the vertical axis stand for
3. What do the horizontal axis stand for
4.How many accidents were there in July
Look at the line graph and answer the following questions.
Traffic accidents.
The number of accidents.
The month.
208.
Exercises
5.What's the number of accidents in August
6.Which month has the most accidents in the chart
7.Which month has the least accidents in the chart
Look at the line graph and answer the following questions.
234.
The October.
July.
Exercises
The number of accidents ________ (went up/went down)
in August.
The number of accidents __________ (went up/went down)
in September.
The number of accidents _________ (went up/went down)
in October.
The number of accidents________ (went up/went down) in November.
went up
went down
went up
went up
Observe the chart carefully and fill in the blanks according to the chart information.
Grammar
Writing
The graph shows that there were(1)_____ traffic accidents in our city in July. In (2) _______ , the number (3) _____to (4)_____ and then(5)____ to (6)_____ in (7) __________. In (8) ________ , the number(9)______again to (10) ____. It (11)____to (12)____ in (13) __________.
Traffic accidents (July- November)
208
August
234
220
September
October
rose
239
fell
224
November
rose
fell
Discussion
The line graph about the number of students at junior high schools in May's city.
1.What does the line graph describe
2.What does the vertical axis stand for
The vertical axis stand for number of students.
3.What do the horizontal axis stand for
The number of students at junior high schools.
Observe the line graph below.Answer the following
questions.
Discussion
4.Which year has the largest number of junior high school students
2010.
5.Which year has the lowest number of junior high school students
2012.
Observe the line graph below.Answer the following questions.
Reading task
Look at the line graph,complete the table below.
Year 2009 2010 2011
2012
Numbers of students 123, 000
Data changes /
120,000
(125,000-5000)
125,000
(123, 000+2, 000)
113,000
(120,000-7000)
went up
went down
went down
Writing skills
一.单元主题
本单元以“数字”为话题,设置的写作题目应与数字有关,如:写一篇与数字相关的故事:写与数字有关的调查报告;表述与数字有关的柱状图或曲线图等。
与数字有关的调查报告——图表作文
二.概念
1.图表类写作题一向是中考书面表达中的难点。它不像看图叙事和提示作文那样直观明了,文体多以说明文和议论文为主。考查时要求同学们根据所给的图表、数据等进行分析、研究,阅读其中的文字和说明,弄清各种信息之间的关系,提炼要点,然后组织语言进行写作,必要时还要加入作者自己的观点。
Writing Skills
与数字有关的调查报告——图表作文
2.和看图叙事不同的是,写图表作文时对图表和数据内容不必全部描述,只需重点引用能支持观点的一些数据。在写作的时候,我们要准确地使用基数词和序数词,恰当地表达数量的多少。如果题目中提供了确切的材料,比如图片、表格或信息点等,我们应充分利用这些材料。分析图表时切不可凭空想象,要善于抓住总的规律和趋势。
3.注意层次性并要适当归纳总结,且要做到语句通顺,语意连贯,没有语法、拼写等
错误。时态方面除特定的时间用过去时外,常用一般现在时。
Writing Skills
三、写作方法指导
1.写作图表作文时应该注意的几个方面:
(1)要对图表作简要的主题介绍。
(2)切忌不加详细分析、罗列数字。要进行横向、纵向的比较,寻找规律性的信息,通过计算找出部分与整体、部分与部分之间的关系,如增减的绝对数字、百分比、分数或倍数等。
(3)分析原因,寻找规律,把握主题。
(4)根据分析所得信息得出结论。
Writing Skills
2.写作过程
仔细审题永远是写作中最重要的部分。认真分析图表的含义,弄清图表中所含的信息及不同信息间的关系,整理要点。
图表作文的结构通常是三段式:
第一段分析图表中的数据变化反映出的问题或趋势,简要概述图表所揭示的信息。
第二段是解释原因的段落,一般要用到一些过渡句。
第三段提出解决问题的办法或建议。
写作时注意直截了当、尽快入题,适当加入自己的议论,力争做到观点明确,不要拐弯抹角,拖泥带水,使人读后一头雾水。
Writing Skills
二、考查形式
1.调查图
如2006年河南试验区中考卷关于“学生吸烟情况”的调查图。
2005年包头市关于学生视力下降原因的调查。
2.表格
如2006年盐城中考卷根据表格设计宣传单饼提出给驾驶员和行人的2条建议。
2005年大连中考卷关于班级去年今年情况对比的表格等。
2005年哈尔滨中考关于压岁钱的使用情况表。
3.柱图
如2006年青海中考卷关于“学生上网目的”的调查。
1. According to /As is shown in the Table /Figure/Chart...
如表格/图表中显示……
2. It has increased by two times as compared with that of ...
同……相比,增长了2倍。
3.From the table/figures/data/results/information above, it concluded/ shown/ estimated/ calculated/
inferred that...
从以上的表格/图表/数据/结果/信息中,我们/总结/预测/计算/得出……
4. A has the highest sales figure in the three departments, followed by B and C.
在3个部门中,A的销售额最高,其次是B和C。
5.The number of students has reached 600, indicating a rise of 30%, compared to last semester.
学生人数达到600人,与上个学期相比上升了30%。
6.The line graph show the changes on... in some place in 2010.
这个折线图显示了2010年一些地方……的变化。
Sentence pattern
Writing Skills
Writing Skills
四、注意事项
文章应包括图表所示内容,但不是全部写到;叙述调查结果时要避免重复使用百分比;最重要的是要有表明自己观点的句子。书写要规范,包括大小写、标点符号等。写作之后还要注意认真检查,改正错误。
7.The table shows the changes in the number of...over the period from...to...
该表格描述了在……年之……年间……数量的变化。
8.It can be drawn from the chart that the proportions of A and B are going down, though the falling level of the latter is a lot lower/higher than that of the former.
尽管后者的下降水平比前者低/高很多,从表中我们可以看到A和B的比例都在下降。
9.The increase/decrease is more noticeable during the second half of the 6 year period.
在6年期的下半年,增加/减少更为明显。
10. It falls from 50% in 2012 to 30% in 2016, and then the trend reverse, finishing at 58% in 2017.
从2012年的50%降至2016年的30%,然后趋势逆转,2017年达到58%。
Sentence pattern
Writing Skills
上升: increase、 grow、 go up、rise、 jump、shoot
下降: fall、decrease、go down、decline、drop
The graph shows that...
The number rose (again)...to...
The number fell (again)... to...
A report with numbers
Good words and good sentences
Writing Skills
Writing
A report with numbers
B Look at the line graph below about the number of students at junior high schools in May's city. Then write a report by following the example in A.
The graph shows that there were 123,000 students at junior high schools in May's city in 2009.
In 2010, the number rose to 125,000, and then fell to 120,000 in 2011.
In 2012, the number fell again to 113,000.
Example analysis
请根据以下交通事故因素( factors)统计图表,以" Major causes of traffic accidents"为题,用英语写一篇简短的分析报告,向学校英语报投稿。
注意:
1.报告须逐条陈述下面 pie chart和 bar chart(柱状图)中呈现的主要内容(至少5点);
2.提出你对交通安全总的看法(至少2点);
3.词数:80左右,开头和结尾已给出,不计入总词数。
Major causes of traffic accidents
Nowadays, there are many traffic accident reports from newspapers TV news and so on.
The harder we try, the happier our life will be!
例题解析
【答案】 Major causes of traffic accidents
Nowadays there are many traffic accident reports from newspapers, TV news and so on. As a result, it's important for gusto analyze the major causes. The followings are the causes.
According to the pie chart, there are mainly three factors: 85% of the causes are driver factors: 5% are vehicle factors and 10% are environment factors. Among them, it's quite clear that driver factors are the key point. So another bar chart points that there are 4 reasons to cause traffic accidents including speeding which is 50%, drunk driving which holds 10%, tired driving which is 20% as well as not using seat belts which is 20%.
In my opinion, everyone should keep in mind that traffic safety is one of the most important things in our life. At the same time, we should try our best to obey the traffic rules.
The harder we try, the happier our life will be!
Example analysis
Example analysis
【解析】这是一篇图标类命题作文。注意要点齐全,不能遗漏。主要以第三人称和一般现在时来说明交通事故发生的原因;对交通安全的中的看法。写作中应适当使用连词。做到上下文联系紧密,符合逻切关系。
【点评】文章中使用了非常好的短语或句子会给文章增色。 keep in mind 记住;try one's best to do sth.尽力做某事; obey the traffic rules 遵守交通规则。 So another bar chart points that there are 4 reasons to cause traffic accidents including speeding which is 50%, drunk driving which holds 10%, tired driving which is 20% as well as not using seat belts which is 20%. (定语从句) In my opinion, everyone should keep in mind that traffic safety is one of the most important things in our life.(形容词最高级) The harder we try, the happier our life will be! (比较级固定句型)还运用了and so on,in my opinion , at the same time 等使上下文衔接的更好。
Summary
1.traffic n.交通
2.accident n.(交通)事故;意外遭遇
Key words
Summary
一、写作图表作文时应该注意的几个方面:
(1)要对图表作简要的主题介绍。
(2)切忌不加详细分析、罗列数字。要进行横向、纵向的比较,寻找规律性的信息,通过计算找出部分与整体、部分与部分之间的关系,如增减的绝对数字、百分比、分数或倍数等。
(3)分析原因,寻找规律,把握主题。
(4)根据分析所得信息得出结论。
图表作文
Summary
2.图表作文的结构通常是三段式:
第一段分析图表中的数据变化反映出的问题或趋势,简要概述图表所揭示的信息。
第二段是解释原因的段落,一般要用到一些过渡句。
第三段提出解决问题的办法或建议。
写作时注意直截了当、尽快入题,适当加入自己的议论,力争做到观点明确,不要拐弯抹角,拖泥带水,使人读后一头雾水。
Homework
1.Review the usage of the key words.
2.Complete the exercises after class.
Grammar
根据图示内容,写一篇40词左右的英语短文。要求语言通顺,意思连贯,表达完整。文章的开头已给出。
The graph shows that our company sold 20.4 million supercomputers in May.
Exercises
Grammar
Exercises
[考点]图表作文
[答案] The graph shows that our company sold 20.4 million supercomputers in May.In June, the number rose to 27.4 million.In July, we sold the most supercomputers, the number of which is 53.2 million.In August, the number fell to 40.8 million.It fell again to 20.1 million in September.
[分析] [高分句型一]
July,we sold the most supercomputers,the number of which is 53.2 million.7月,我们销售了最多的超级计算机,数量为5320万台。
the number ....的数量。
[高分句型二]
In August,the number fell to 40.8 million.8月份, 这一数字降至4080万。
fall to降到......
[解答] The graph shows that our company sold 20.4 million supercomputers in May. (5月) In June,the number rose to 27.4 million. (6月) In July,we sold the most supercomputers,the number of which is 53.2 million. [高分句型一] (7月) In August,the number fell to 40.8 million. [高分句型二] (8月) It fell again to 20.1 million in September. (9月)
谢谢
21世纪教育网(www.21cnjy.com)
中小学教育资源网站
兼职招聘:
https://www.21cnjy.com/recruitment/home/admin
Unit 2 Numbers
Period 4 Writing
牛津深圳·广州版八年级上册
Learning objectives
1.Knowledge objectives:
① Master the key words such as traffic and accident.
② Students understand what line chart is and the purpose of using line chart.
2.Skill objectives:
① Students can describe the changes of data in the graph with appropriate words according to the graph.
② Through the analysis of the structure and data of graphics, students can know the information about the changes of graphics data.
③ Read the data changes in the graph and complete a report reflecting the changes in the number of traffic accidents in different months.
④ According to the changes in the data in the graph, write a report reflecting the changes in the number of junior high school students in different years.
Learning objectives
3.Emotional objectives:
① Cultivate students' team work ability, and students can correct other students' compositions.
② Through learning how to use the numbers in the analysis chart, students' interest in mathematics can be improved.
4.Thinking capacity:
Cultivate students' independent thinking ability, improve their thinking ability, and be able to objectively judge and analyze data, improve their own innovative thinking, and express independent opinions.
Lead in
what are the role of numbers in daily life
price
time
length
weight
date
room number
bus
the uses of
numbers
in daily life
Student A:What do we use numbers for
Student B: We use numbers to analyze many numbers.
Student A:Why should we analyze the figures
Student B:Because I can find problems and try to solve them.
(We can understand how things change.
It can help us understand the world better.)
分组角色扮演讨论
1.同学两人一组,进行对话练习。
2.角色对换,进行对话练习。
3.下列句型可能对你有所帮助。
What do we use numbers for
We use numbers to analyze many numbers.
We use numbers to analyze...
Role play
Presentation
traffic
[ tr f k] n.
May found some figures about traffic accidents in her city.
Presentation
accident [ ks d nt] n.
May found some figures about traffic accidents in her city.
Which tables and charts are used to analyze the data
Table(表格)
Bar chart(柱状图)
Pie chart(饼状图)
Line graph (折线图)
Pr-writing
Grammar
Which table / chart /graph can help may
Pr-writing
The bar chart is easy to see the data changes of various quantities over time, and can clearly and directly compare the numbers.
The line chart is used to show the continuous trend change of values over a period of time.
Grammar
Discussion
Which table / chart /graph can help may
The pie chart shows the percentage of item size to the total number of
items in the data series.
The table can quickly find and process a
large amount of data and display accurate
and specific data.
游戏规则:
1.请全班分组与小组内同学以问答的
形式进行对话。
2.问答内容是问搭档哪一种表格/图表可以帮助梅。
3.与搭档互换角色,完成对话。
4.下列句型可能对你有所帮助:
Student A:Which table / chart /graph can help May
Student B:I think line graph can help May, because...
Group discussion
Which table / chart /graph can help May
I think line graph can help May, because...
Pr-writing
What are the advantages of a line graph
It can clearly show the changes and the tendency.
Observe the line chart and answer the following questions.
Grammar
Writing
A May found some figures about traffic accidents in her city. She drew a line graph and wrote a plete the report below.
A report with numbers
Write the numbers in
figures, not in words.
Top tip
Exercises
1.What's the line graph about
2.What do the vertical axis stand for
3. What do the horizontal axis stand for
4.How many accidents were there in July
Look at the line graph and answer the following questions.
Traffic accidents.
The number of accidents.
The month.
208.
Exercises
5.What's the number of accidents in August
6.Which month has the most accidents in the chart
7.Which month has the least accidents in the chart
Look at the line graph and answer the following questions.
234.
The October.
July.
Exercises
The number of accidents ________ (went up/went down)
in August.
The number of accidents __________ (went up/went down)
in September.
The number of accidents _________ (went up/went down)
in October.
The number of accidents________ (went up/went down) in November.
went up
went down
went up
went up
Observe the chart carefully and fill in the blanks according to the chart information.
Grammar
Writing
The graph shows that there were(1)_____ traffic accidents in our city in July. In (2) _______ , the number (3) _____to (4)_____ and then(5)____ to (6)_____ in (7) __________. In (8) ________ , the number(9)______again to (10) ____. It (11)____to (12)____ in (13) __________.
Traffic accidents (July- November)
208
August
234
220
September
October
rose
239
fell
224
November
rose
fell
Discussion
The line graph about the number of students at junior high schools in May's city.
1.What does the line graph describe
2.What does the vertical axis stand for
The vertical axis stand for number of students.
3.What do the horizontal axis stand for
The number of students at junior high schools.
Observe the line graph below.Answer the following
questions.
Discussion
4.Which year has the largest number of junior high school students
2010.
5.Which year has the lowest number of junior high school students
2012.
Observe the line graph below.Answer the following questions.
Reading task
Look at the line graph,complete the table below.
Year 2009 2010 2011
2012
Numbers of students 123, 000
Data changes /
120,000
(125,000-5000)
125,000
(123, 000+2, 000)
113,000
(120,000-7000)
went up
went down
went down
Writing skills
一.单元主题
本单元以“数字”为话题,设置的写作题目应与数字有关,如:写一篇与数字相关的故事:写与数字有关的调查报告;表述与数字有关的柱状图或曲线图等。
与数字有关的调查报告——图表作文
二.概念
1.图表类写作题一向是中考书面表达中的难点。它不像看图叙事和提示作文那样直观明了,文体多以说明文和议论文为主。考查时要求同学们根据所给的图表、数据等进行分析、研究,阅读其中的文字和说明,弄清各种信息之间的关系,提炼要点,然后组织语言进行写作,必要时还要加入作者自己的观点。
Writing Skills
与数字有关的调查报告——图表作文
2.和看图叙事不同的是,写图表作文时对图表和数据内容不必全部描述,只需重点引用能支持观点的一些数据。在写作的时候,我们要准确地使用基数词和序数词,恰当地表达数量的多少。如果题目中提供了确切的材料,比如图片、表格或信息点等,我们应充分利用这些材料。分析图表时切不可凭空想象,要善于抓住总的规律和趋势。
3.注意层次性并要适当归纳总结,且要做到语句通顺,语意连贯,没有语法、拼写等
错误。时态方面除特定的时间用过去时外,常用一般现在时。
Writing Skills
三、写作方法指导
1.写作图表作文时应该注意的几个方面:
(1)要对图表作简要的主题介绍。
(2)切忌不加详细分析、罗列数字。要进行横向、纵向的比较,寻找规律性的信息,通过计算找出部分与整体、部分与部分之间的关系,如增减的绝对数字、百分比、分数或倍数等。
(3)分析原因,寻找规律,把握主题。
(4)根据分析所得信息得出结论。
Writing Skills
2.写作过程
仔细审题永远是写作中最重要的部分。认真分析图表的含义,弄清图表中所含的信息及不同信息间的关系,整理要点。
图表作文的结构通常是三段式:
第一段分析图表中的数据变化反映出的问题或趋势,简要概述图表所揭示的信息。
第二段是解释原因的段落,一般要用到一些过渡句。
第三段提出解决问题的办法或建议。
写作时注意直截了当、尽快入题,适当加入自己的议论,力争做到观点明确,不要拐弯抹角,拖泥带水,使人读后一头雾水。
Writing Skills
二、考查形式
1.调查图
如2006年河南试验区中考卷关于“学生吸烟情况”的调查图。
2005年包头市关于学生视力下降原因的调查。
2.表格
如2006年盐城中考卷根据表格设计宣传单饼提出给驾驶员和行人的2条建议。
2005年大连中考卷关于班级去年今年情况对比的表格等。
2005年哈尔滨中考关于压岁钱的使用情况表。
3.柱图
如2006年青海中考卷关于“学生上网目的”的调查。
1. According to /As is shown in the Table /Figure/Chart...
如表格/图表中显示……
2. It has increased by two times as compared with that of ...
同……相比,增长了2倍。
3.From the table/figures/data/results/information above, it concluded/ shown/ estimated/ calculated/
inferred that...
从以上的表格/图表/数据/结果/信息中,我们/总结/预测/计算/得出……
4. A has the highest sales figure in the three departments, followed by B and C.
在3个部门中,A的销售额最高,其次是B和C。
5.The number of students has reached 600, indicating a rise of 30%, compared to last semester.
学生人数达到600人,与上个学期相比上升了30%。
6.The line graph show the changes on... in some place in 2010.
这个折线图显示了2010年一些地方……的变化。
Sentence pattern
Writing Skills
Writing Skills
四、注意事项
文章应包括图表所示内容,但不是全部写到;叙述调查结果时要避免重复使用百分比;最重要的是要有表明自己观点的句子。书写要规范,包括大小写、标点符号等。写作之后还要注意认真检查,改正错误。
7.The table shows the changes in the number of...over the period from...to...
该表格描述了在……年之……年间……数量的变化。
8.It can be drawn from the chart that the proportions of A and B are going down, though the falling level of the latter is a lot lower/higher than that of the former.
尽管后者的下降水平比前者低/高很多,从表中我们可以看到A和B的比例都在下降。
9.The increase/decrease is more noticeable during the second half of the 6 year period.
在6年期的下半年,增加/减少更为明显。
10. It falls from 50% in 2012 to 30% in 2016, and then the trend reverse, finishing at 58% in 2017.
从2012年的50%降至2016年的30%,然后趋势逆转,2017年达到58%。
Sentence pattern
Writing Skills
上升: increase、 grow、 go up、rise、 jump、shoot
下降: fall、decrease、go down、decline、drop
The graph shows that...
The number rose (again)...to...
The number fell (again)... to...
A report with numbers
Good words and good sentences
Writing Skills
Writing
A report with numbers
B Look at the line graph below about the number of students at junior high schools in May's city. Then write a report by following the example in A.
The graph shows that there were 123,000 students at junior high schools in May's city in 2009.
In 2010, the number rose to 125,000, and then fell to 120,000 in 2011.
In 2012, the number fell again to 113,000.
Example analysis
请根据以下交通事故因素( factors)统计图表,以" Major causes of traffic accidents"为题,用英语写一篇简短的分析报告,向学校英语报投稿。
注意:
1.报告须逐条陈述下面 pie chart和 bar chart(柱状图)中呈现的主要内容(至少5点);
2.提出你对交通安全总的看法(至少2点);
3.词数:80左右,开头和结尾已给出,不计入总词数。
Major causes of traffic accidents
Nowadays, there are many traffic accident reports from newspapers TV news and so on.
The harder we try, the happier our life will be!
例题解析
【答案】 Major causes of traffic accidents
Nowadays there are many traffic accident reports from newspapers, TV news and so on. As a result, it's important for gusto analyze the major causes. The followings are the causes.
According to the pie chart, there are mainly three factors: 85% of the causes are driver factors: 5% are vehicle factors and 10% are environment factors. Among them, it's quite clear that driver factors are the key point. So another bar chart points that there are 4 reasons to cause traffic accidents including speeding which is 50%, drunk driving which holds 10%, tired driving which is 20% as well as not using seat belts which is 20%.
In my opinion, everyone should keep in mind that traffic safety is one of the most important things in our life. At the same time, we should try our best to obey the traffic rules.
The harder we try, the happier our life will be!
Example analysis
Example analysis
【解析】这是一篇图标类命题作文。注意要点齐全,不能遗漏。主要以第三人称和一般现在时来说明交通事故发生的原因;对交通安全的中的看法。写作中应适当使用连词。做到上下文联系紧密,符合逻切关系。
【点评】文章中使用了非常好的短语或句子会给文章增色。 keep in mind 记住;try one's best to do sth.尽力做某事; obey the traffic rules 遵守交通规则。 So another bar chart points that there are 4 reasons to cause traffic accidents including speeding which is 50%, drunk driving which holds 10%, tired driving which is 20% as well as not using seat belts which is 20%. (定语从句) In my opinion, everyone should keep in mind that traffic safety is one of the most important things in our life.(形容词最高级) The harder we try, the happier our life will be! (比较级固定句型)还运用了and so on,in my opinion , at the same time 等使上下文衔接的更好。
Summary
1.traffic n.交通
2.accident n.(交通)事故;意外遭遇
Key words
Summary
一、写作图表作文时应该注意的几个方面:
(1)要对图表作简要的主题介绍。
(2)切忌不加详细分析、罗列数字。要进行横向、纵向的比较,寻找规律性的信息,通过计算找出部分与整体、部分与部分之间的关系,如增减的绝对数字、百分比、分数或倍数等。
(3)分析原因,寻找规律,把握主题。
(4)根据分析所得信息得出结论。
图表作文
Summary
2.图表作文的结构通常是三段式:
第一段分析图表中的数据变化反映出的问题或趋势,简要概述图表所揭示的信息。
第二段是解释原因的段落,一般要用到一些过渡句。
第三段提出解决问题的办法或建议。
写作时注意直截了当、尽快入题,适当加入自己的议论,力争做到观点明确,不要拐弯抹角,拖泥带水,使人读后一头雾水。
Homework
1.Review the usage of the key words.
2.Complete the exercises after class.
Grammar
根据图示内容,写一篇40词左右的英语短文。要求语言通顺,意思连贯,表达完整。文章的开头已给出。
The graph shows that our company sold 20.4 million supercomputers in May.
Exercises
Grammar
Exercises
[考点]图表作文
[答案] The graph shows that our company sold 20.4 million supercomputers in May.In June, the number rose to 27.4 million.In July, we sold the most supercomputers, the number of which is 53.2 million.In August, the number fell to 40.8 million.It fell again to 20.1 million in September.
[分析] [高分句型一]
July,we sold the most supercomputers,the number of which is 53.2 million.7月,我们销售了最多的超级计算机,数量为5320万台。
the number ....的数量。
[高分句型二]
In August,the number fell to 40.8 million.8月份, 这一数字降至4080万。
fall to降到......
[解答] The graph shows that our company sold 20.4 million supercomputers in May. (5月) In June,the number rose to 27.4 million. (6月) In July,we sold the most supercomputers,the number of which is 53.2 million. [高分句型一] (7月) In August,the number fell to 40.8 million. [高分句型二] (8月) It fell again to 20.1 million in September. (9月)
谢谢
21世纪教育网(www.21cnjy.com)
中小学教育资源网站
兼职招聘:
https://www.21cnjy.com/recruitment/home/admin