译林版(2019)必修三: Unit 3 The world online Integrated skills 课件(11张ppt)
文档属性
| 名称 | 译林版(2019)必修三: Unit 3 The world online Integrated skills 课件(11张ppt) |  | |
| 格式 | pptx | ||
| 文件大小 | 18.1MB | ||
| 资源类型 | 教案 | ||
| 版本资源 | 牛津译林版(2019) | ||
| 科目 | 英语 | ||
| 更新时间 | 2022-11-06 14:05:29 | ||
图片预览


文档简介
(共11张PPT)
Integrated Skills
Reporting on Internet use
B3U3
Teacher:
Date:
Questions to lead-in
1. Do you often use the Internet How about your parents
2. In which way do you usually access the Internet, using a mobile device or other devices
3. What do you often do on the Internet
Listen to the talk and answer the questions
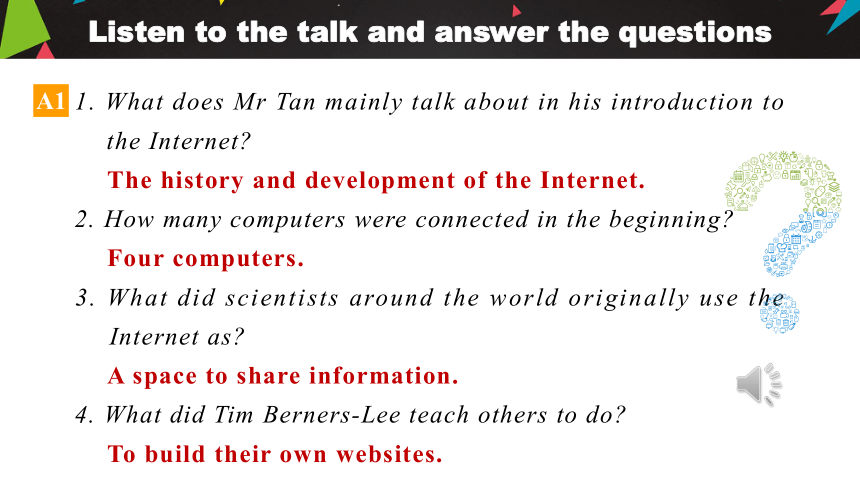
1. What does Mr Tan mainly talk about in his introduction to the Internet
The history and development of the Internet.
2. How many computers were connected in the beginning
Four computers.
3. What did scientists around the world originally use the Internet as
A space to share information.
4. What did Tim Berners-Lee teach others to do
To build their own websites.
A1
Listen to the talk again
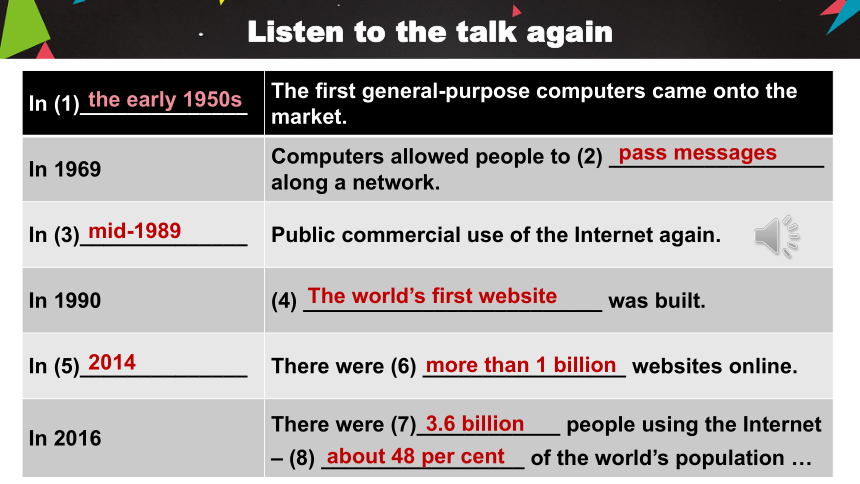
In (1)______________ The first general-purpose computers came onto the market.
In 1969 Computers allowed people to (2) __________________ along a network.
In (3)______________ Public commercial use of the Internet again.
In 1990 (4) _________________________ was built.
In (5)______________ There were (6) _________________ websites online.
In 2016 There were (7)____________ people using the Internet – (8) _________________ of the world’s population …
the early 1950s
pass messages
mid-1989
The world’s first website
2014
more than 1 billion
3.6 billion
about 48 per cent
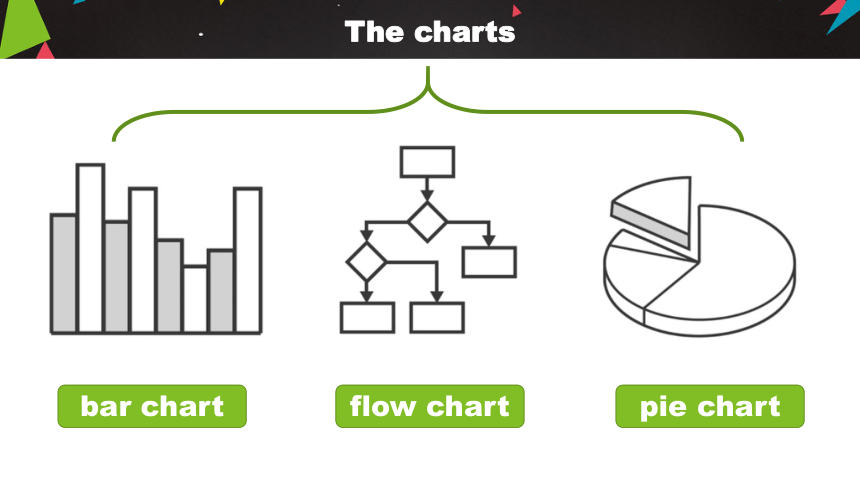
The charts
bar chart
flow chart
pie chart
Part B
1. According to the first chart, which use of the Internet has increased the most during the last five years
Travel booking.
2. What change can you see from the two pie charts
More and more people have been going online using mobile devices.
3. In the last chart, what change do you notice in the Internet users above 59
An increasing number of people above 59 use the Internet now.
Useful Expressions
As can be seen/conveyed/illustrated/reflected from the bar/pie chart, …
There is/has been a rise/an increase/a drop of/a decrease of … per cent.
The number has risen/increased/dropped/decreased from … to …
The figure has gone up/gone down/fallen by … per cent.
… times as many people went online using mobile devices.
… the figure/number/percentage remains/stays the same/unchanged.
… has remained/stayed the same/unchanged.
C
Writing
Chart 1
As can be seen/conveyed/illustrated/reflected from the bar chart, over the past five years, the number of people using the Internet for news/search engines/instant messaging/shopping/payment/travel booking has risen/increased from 65% to 82%, from 92% to 98%, from 80% to 90%, from about 39% to 61%, from about 31% to 61%, from about 8% to 40% respectively.
Writing
Chart 2
As can be reflected from the pie charts, over the past five years, the number of users who access the Internet using mobile devices have risen/increased from 69% to 95%, while the percentage of users who access the Internet without using mobile devices has dropped/decreased from 31% to 5%.
Writing
Chart 3
As can be conveyed from the chart, over the past five years, the number of Internet users has been increasing in most age groups, but the 20-39 age group has decreased by about 10%.
THANK YOU
Reporting on Internet use
B2U3
Teacher:
Date:
同课章节目录
- Unit 1 Nature in the balance
- Welcome to the unit
- Reading
- Grammar and usage
- Integrated skills
- Extended reading
- Project
- Unit 2 Natural disasters
- Welcome to the unit
- Reading
- Grammar and usage
- Integrated skills
- Extended reading
- Project
- Unit 3 The world online
- Welcome to the unit
- Reading
- Grammar and usage
- Integrated skills
- Extended reading
- Project
- Unit 4 Scientists who changed the world
- Welcome to the unit
- Reading
- Grammar and usage
- Integrated skills
- Extended reading
- Project
