北师大版(2019)必修 第三册Unit 8 Green living Writing Workshop名师教学设计
文档属性
| 名称 | 北师大版(2019)必修 第三册Unit 8 Green living Writing Workshop名师教学设计 |

|
|
| 格式 | docx | ||
| 文件大小 | 452.3KB | ||
| 资源类型 | 教案 | ||
| 版本资源 | 北师大版(2019) | ||
| 科目 | 英语 | ||
| 更新时间 | 2023-03-07 21:44:48 | ||
图片预览


文档简介
Unit 8 Writing Workshop 名师教学设计
课时内容:
A Survey Report
主题语境:人与自然
主题群:环境保护
子主题:人与环境
语篇类型:说明文——调查报告
文本分析:
[What]本文是一份调查报告,作者通过柱状图、饼状图等统计图详细说明了调查样本在环境保护方面的意识与行动方面的成绩与存在的问题,并得出了结论。
[Why]通过学习本篇文章,学生了解到人们在环保方面的意识和采取的行动中存在的不足与问题,以此激励学生从身边小事做起,从自我做起,树立“爱护环境、人人有责”的意识,承担自己的社会责任,为环境保护贡献自己的份力量。
[How]这篇调查报告由四部分组成:第一部分简单介绍调查的主题和基本信息;二三部分用统计图的形式,客观呈现了调查的结果,第二部分介绍调查结果中好的一面,即市民的环保意识和采取的行动,第三部分介绍调查中发现的问题与存在的不足;第四部分对调查结果进行总结并提出建议和意见。
课时目标:
1.获取调查报告中关于市民环保意识和行为的事实性信息,梳理调查的时间、地点、目的、参加的人员、调查的具体问题和建议等。
2.赏析调查报告的语言和句式特点,分析调查报告的文本结构、组成部分及具体内容。
3.写一篇关于共享单车使用情况的调查报告。
重点难点:
重点:
1.获取调查报告中呈现的事实性信息。
2.学习调查报告的文本结构、组成部分和具体内容。
难点:
运用饼状图与柱状图进行定量表述。
教学准备:
教师准备:
1.调查报告的写作方法。
2.饼状图与柱状图的运用方法。
学生准备:
1.预习本课词汇。
2.预习调查报告的写作方法。
教学过程:
Step I学习理解
活动一:获取与梳理
1. Pair work.
Ask students to explore the question “What should be included in a survey report ” and discuss their ideas in pairs.
Suggested answers: a clear purpose appropriate quantity expressions proper graphs a conclusion a logical organisation
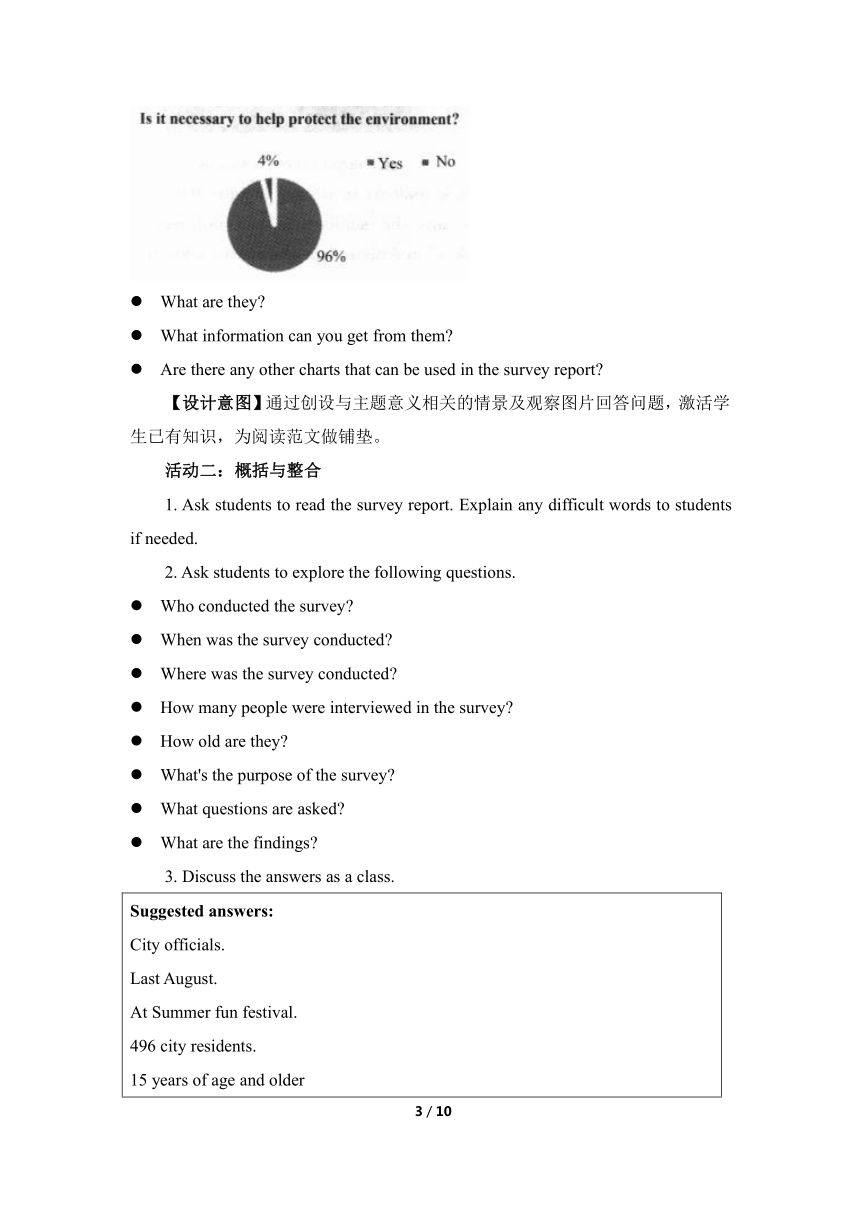
2. Ask students to look at the bar chart & the pie chart and answer the questions below.
A Survey taken last August at Summer Fun Festival by city officials. It involved 496 city residents (15 years of age and older).
What are they
What information can you get from them
Are there any other charts that can be used in the survey report
【设计意图】通过创设与主题意义相关的情景及观察图片回答问题,激活学生已有知识,为阅读范文做铺垫。
活动二:概括与整合
1. Ask students to read the survey report. Explain any difficult words to students if needed.
2. Ask students to explore the following questions.
Who conducted the survey
When was the survey conducted
Where was the survey conducted
How many people were interviewed in the survey
How old are they
What's the purpose of the survey
What questions are asked
What are the findings
3. Discuss the answers as a class.
Suggested answers: City officials. Last August. At Summer fun festival. 496 city residents. 15 years of age and older To find out people’s attitudes to protecting the environment and what actions they have taken. Is it necessary to help protect the environment What actions have you taken to help protect the environment As the diagram shows, the percentage of those who felt that they needed to help protect the environment is as high as 96%. Very few (4%) felt it was not necessary. More than half of those who took part in the survey had done four of the five activities in the past month. Around 90% had tried to recycle waste such as glass, metal and paper; and more than two thirds (70%) had tried to cut back on the use of disposable packaging, such as plastic honey bottles and butter and yoghurt containers. Also, the majority of residents had cycled or walked. Not as many who took part had taken action to save water and energy in their homes. Just under 40% (38%) tried to save water when they were washing dishes or taking showers. Just over half (51%) tried to save energy by reducing the use of air conditioning or turning off lights.
4. What is a survey report
Suggested answer: A survey report is a formal piece of writing based on research.
【设计意图】教师要求学生先阅读调查报告的范文,然后回答相关问题,引导学生获取文本的基本信息,并了解调查报告的文体特征。
Step Ⅱ 应用实践
活动三:分析与判断
1. Headings.
(1) Ask students to read the survey report again and label each paragraph of the report with the following headings.
a Introduction c Negative findings b Conclusion d Positive findings
(2) Discuss the answers in class.
Suggested answers: a d c b
2. Structure.
Work in groups and conclude the structure.
(1) Introduction.
State the purpose se/aim of the report, when and how he information is gathered.
(2) Main Body: Negative findings & Positive findings
All the information collected and analyzed is presented clearly and in detail (break the respondents into groups according to sex, age and place of residence, state the main differences between groups ) Subheadings, numbers or letters can be used to separate each piece of information.
(3) Conclusion.
Sum up the main points of the report. If necessary a recommendation can be included as well. (One way of summing up is making some general comments.)
3. Useful hints and phrases.
Analyze things that should be paid attention to.
Suggested answers: Present tenses, reported speech and an impersonal style should be used in survey reports. Use a variety of reporting verbs such as claim, state, report agree, complain, suggest, etc.
4. Figures and quantity expressions.
(1) When reporting the results of a survey, the figures gathered should be given in the form of percentages and proportions. Expressions such as “one in four” and “six out of ten”, or exact percentages (e. g. 25 of the people questioned, 68% of those who filled in the questionnaire etc.) can be used. Less exact expressions such as the majority of those questioned, a large proportion of, a significant number of, etc. can also be used.
(2) Ask students to underline the quantity expressions in the survey report and use the Sentence Builder to help them.
Suggested answers: Quantity expressions: Last August, city officials interviewed about 500 residents to … As the diagram shows,... as high as 96%. Very few (4%) felt it was not necessary. More than half of those who took part in the survey had done four of the five activities in the past month. Around 90% had tried to recycle waste such as glass, metal and paper; and more than two thirds (70 %) had tried to… and butter and yoghurt containers. Also, the majority of residents had cycled or walked. Unfortunately, not as many who took part had taken action to save water and energy in their homes. Just under 40% (38%) tried to save water when they were washing dishes or taking showers. Just over half (51%) tried… To sum up, it seems that almost all who took part understood the need to help take care of the environment. Most of them tried to recycle waste ride bikes or walk, and reduce the use of disposable packaging. However, not as many were saving water and energy…
5. The bar chart & the pie chart.
(1) What is a bar chart used for
A bar chart is a visual tool that uses bars to compare data among categories. a bar chart may run horizontally or vertically. The important thing to know is that the longer the bar, the greater its value.
A bar chart consists of two axes. One shows the data categories. The other is about the scale.
(2) What is a pie chart
A pie chart is a circular chart divided int areas, illustrating the relative proportions of a set of things.
Pie charts can make the size of portions easy to understand at a glance. They’re widely used in business presentations and education to show the proportions among a large variety of categories including expenses, segments of a population, or answers to a survey.
【设计意图】教师引导学生归纳报告各个部分的具体内容,为四个自然段选择合适的标题,了解调查报告的具体结构、短语、数据、定量表述语句、柱状图和饼状图等。
活动四:内化与应用
Compose your writing.
1. Outlining.
Ask students to write an outline for a report based on the data below. Students can also do a survey online write a report based on the data they got.
(1) Divide the draft into three parts.
Introduction: situation of using shared bikes.
Main body:
Positive findings: Why do you use shared bikes
Negative findings: Why don't you use shared hikes
Conclusion: Most of interviewees use shared bikes.
(2) Figures, quantity expressions and the pie chart the bar chart.
as high as/almost all
about/around
most of/ more than/the majority of
just under/just over
not as many/very few
2. Drafting.
Have students use their outlines and the Writing help to write their first drafts.
【设计意图】教师先提供写作建议,供学生参考,随后引导学生模仿范文完成关于共享单车调查报告的大纲和初稿。在此过程中,教师引导学生围绕本课主题和学生已经掌握的各种句型展开描述和写作,逐步实现对语言知识和文化知识的内化,促进语言运用的自动化,助力学生将知识转化为能力。
Step Ⅲ 迁移创新
活动五:批判与评价
1. Edit your report in pairs.
Mark any spelling, punctuation or grammar errors. Mark any unclear expressions. Give suggestions if you can. Underline the expressions you like.
2. Take the draft back and revise it.
3. Share the survey report with the rest of the class.
【设计意图】该活动有助于加强学生之间的互动交流,促进自我监督式的学习,并在相互评价中不断反思,取长补短,总结经验,调控学习,把教学评价变成主体参与、自我反思、相互激励、共同发展的过程和手段。
板书设计:
Unit 8 Green Living Period V Writing Workshop I.学习理解 活动一:获取与梳理 活动二:概括与整合 II.应用实践 活动三:分析与判断 1. Headings. 2. Structure. 3. Useful hints and phrases. 4. Figures and quantity expressions. 5. The bar chart & the pie chart. 活动四:内化与应用 Compose your writing. 1. Outlining. 2. Drafting. Ⅲ.迁移创新 活动五:批判与评价
2 / 2
同课章节目录
- Unit 7 Art
- Lesson 1 Masterpieces
- Lesson 2 Beijing Opera
- Lesson 3 A Musical Genius
- Unit 8 Green living
- Lesson 1 Roots and Shoots
- Lesson 2 Greening the Desert
- Lesson 3 "White Bikes" on the Road
- Unit 9 Learning
- Lesson 1 Active Learning
- Lesson 2 Language Learning Tips
- Lesson 3 The Secrets of Your Memory
