北师大版(2019)必修 第三册Unit 8 Green living Writing workshop 课件(共34张PPT)
文档属性
| 名称 | 北师大版(2019)必修 第三册Unit 8 Green living Writing workshop 课件(共34张PPT) |
|
|
| 格式 | pptx | ||
| 文件大小 | 2.2MB | ||
| 资源类型 | 教案 | ||
| 版本资源 | 北师大版(2019) | ||
| 科目 | 英语 | ||
| 更新时间 | 2023-05-29 00:00:00 | ||
图片预览


文档简介
(共34张PPT)
Unit 8
Green Living
A Survey Report
To read and understand a survey report.
To identify the main idea of each paragraph and label it correctly.
To read and understand graphs.
To use expressions relating to quantity.
To write a survey report.(outline)
Teaching Aims
Get to the new words
Perceive & notice
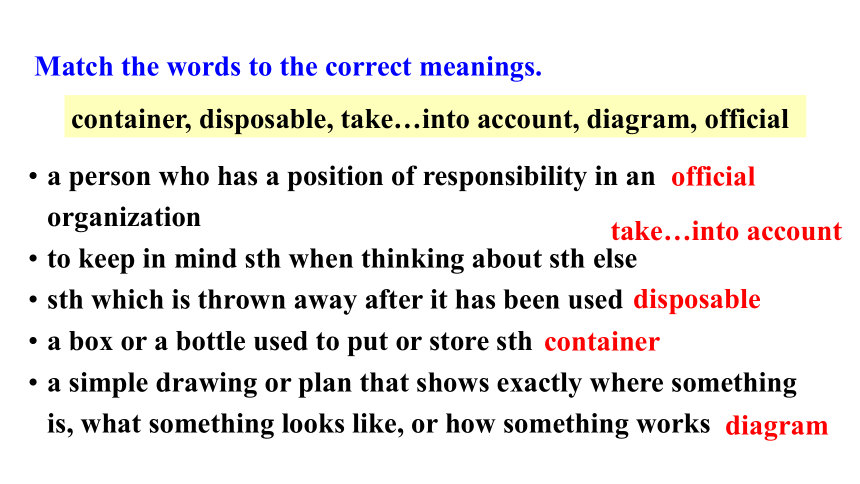
a person who has a position of responsibility in an organization
to keep in mind sth when thinking about sth else
sth which is thrown away after it has been used
a box or a bottle used to put or store sth
a simple drawing or plan that shows exactly where something is, what something looks like, or how something works
container, disposable, take…into account, diagram, official
official
take…into account
disposable
container
diagram
Match the words to the correct meanings.
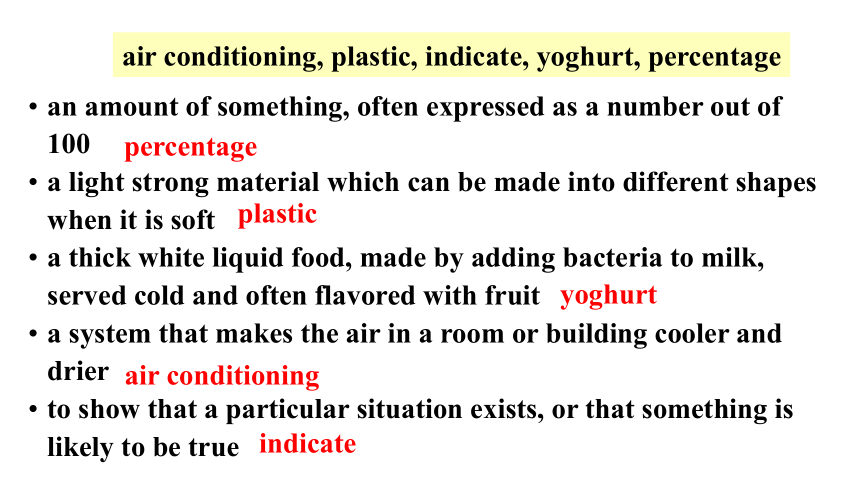
an amount of something, often expressed as a number out of 100
a light strong material which can be made into different shapes when it is soft
a thick white liquid food, made by adding bacteria to milk, served cold and often flavored with fruit
a system that makes the air in a room or building cooler and drier
to show that a particular situation exists, or that something is likely to be true
air conditioning, plastic, indicate, yoghurt, percentage
percentage
plastic
yoghurt
air conditioning
indicate
n. 居民
You are going to write a survey on environmental protection for the residents in your city or town. What should be included in a survey report
Discuss your ideas in pairs.
关于环境保护的调查
Perceive & notice
Read the text silently on your own. Discuss the two questions in pairs. Underline all the questions asked.
What questions are asked (Para.1)
Is it necessary to help protect environment?
What actions have you taken to protect the environment
Perceive & notice
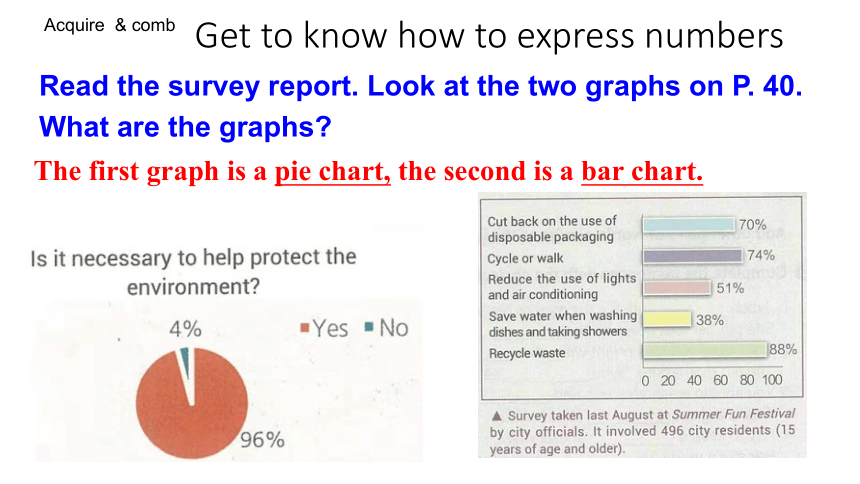
Read the survey report. Look at the two graphs on P. 40. What are the graphs
The first graph is a pie chart, the second is a bar chart.
Acquire & comb
Get to know how to express numbers
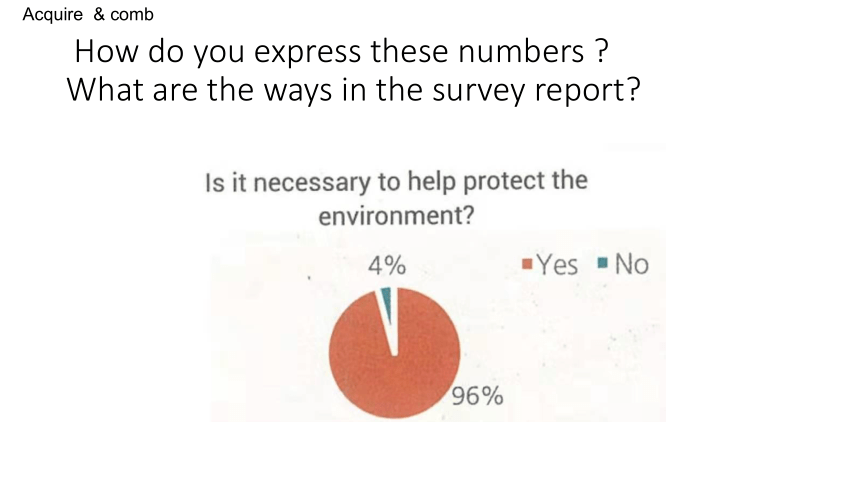
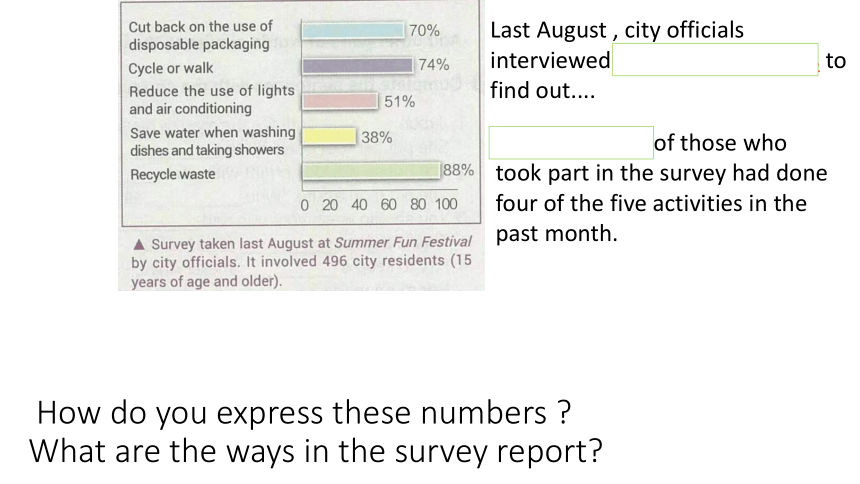
How do you express these numbers
What are the ways in the survey report
Acquire & comb
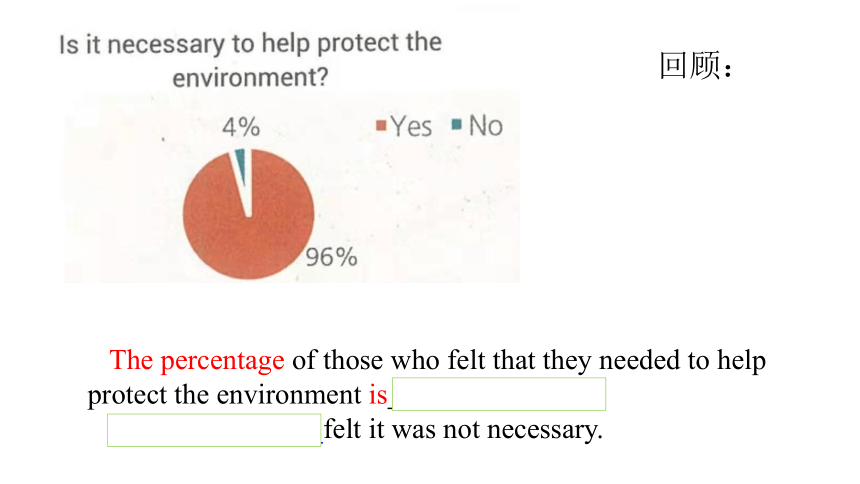
The percentage of those who felt that they needed to help protect the environment is as high as 96%.
Very few (4% )felt it was not necessary.
回顾:
How do you express these numbers
What are the ways in the survey report
Last August , city officials interviewed about 500 residents to find out....
More than half of those who took part in the survey had done four of the five activities in the past month.
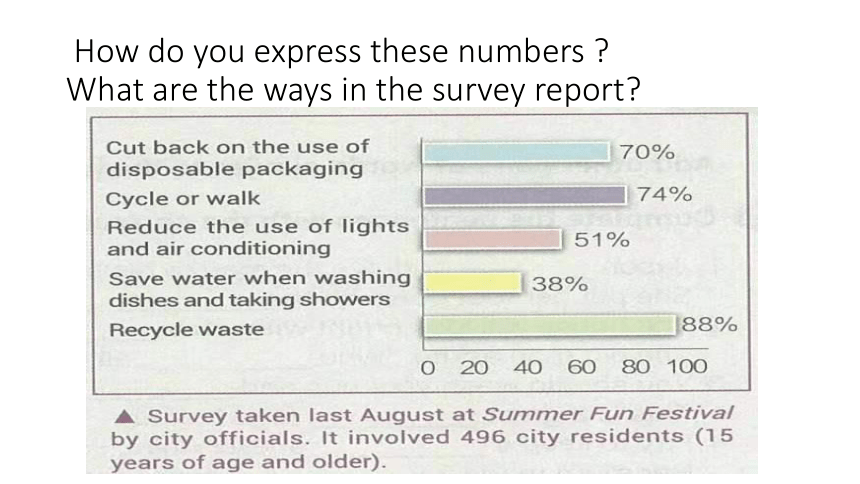
How do you express these numbers
What are the ways in the survey report
Around 90% (88%) had tried to recycle waste , such as glass, metal
and paper; and more than two thirds (70%) had tried to cut back on the use of disposable packaging, such as plastic, honey bottles and butter and yogurt containers. Also the majority of residents (74%)had
cycled or walked.
Unfortunately, not as many (没有多少人) who took part had taken action to save water and energy in their homes. Just under 40% (38%) try to save water when they were washing dishes or taking showers. Just over half ( 51% ) tried to save energy by reducing the use of air conditioning or turning off lights.
Acquire & comb
What are the advantages of the ways the article is presented
Giving numbers and quantity in this way makes a report more interesting and not a mere presentation of numbers
Analyze & judge
Get to know the structure of a survey report
Label ( 贴...) each paragraph of the report with the following headings.
Introduction
Conclusion
Negative findings
Positive findings
Summarize & integrate
a. Introduction
c. Negative findings
b. Conclusion
d. Positive findings
Summarize & integrate
Get to know the structure of a survey report
A Survey Report
Para 1: Introduction
Para 2: Positive findings
Para 3: Negative findings
Para 4: Conclusion
Summarize & integrate
写调查报告时,很重要的是 1.介绍调查的目的、参与人数、整体调查结果2. 描述调查的主要结果及支持数字3.使用数量表达式和适当的图表。 4.总结你的发现并给出建议
(When writing a survey report, it's important to
1. introduce the survey, for example, its purpose, the number of those taking part, the overall findings
2. describe the major findings and supporting figures in the survey
3.use quantity expressions and proper graphs
4. summarize your findings and give recommendations)
Internalize & apply
Use the structure in activity 3, make notes in order to organize the information for your report:
Use the outline of the report on page 40 to organize and use the quantity expressions in the Sentence Builder.
Work only on the outline and not the actual report.
Write an outline for your report based on Activities 3 and 4, and the data on page 41. You can also do a survey online and write a report based on the data you got.
Internalize & apply
Last month, city officials ___________________ ( 496 市民)to find out people's attitudes to using shared bikes and the reasons . Here are the results. As the diagram shows, ____________ ( 70%) of those who took part in the survey have used shared bikes while ________________ (不到三分之一)(30%) haven’t.
interviewed about 500 residents
more than two thirds
less than one third
Internalize & apply
As high as 96% of those who have used shared bikes thought it was convenient to use one.
Nearly 70% thought it was cheap to use shared bikes. Only less than 20% thought using shared bikes was good for reducing pollution. Slightly over 30% thought it was a good form of exercise.
高达96%
接近70%
只有不到20%
略微超过30%
Among those who haven’t used shared bikes, more than two thirds regarded it unsafe. And less than one third of them though it too hot in summer and too cold in winter to ride a bike.
不到三分之一
超过三分之二
To sum up, more than two thirds of those who took part ever used shared bikes, either because of its convenience (convenient) or because of being ( be ) cheap. However, among those who did not use shared bikes, a majority (major) thought they were not safe. This indicates that it is necessary (necessity) for the city government to strengthen (strong) road safety management.The design of shared bikes should pay more attention to its safety (safe) .
总之 总而言之
______________
_____
________
__________
__________
______
Use your outline and the Writing Help to write your first draft.
Think of an appropriate recommendation based on the data you have.
Copy the graphs provided in the correct section of your report by roughly sketching them.
Edit your report in pairs. Then share what you have written in class.
The final stage of writing is editing. Check ideas are clear and sentences are complete.
Exchange your writing with your partner and offer each other suggestions to improve your draft.
Imagine & create
Peer Editing Sheet on page 93. Pay attention to the questions.
Write comments, both positive as well as negative.
Make changes to your drafts.
Prepare a final draft of your work.
一、审题定调
调查报告是针对生活中的某一现象、事情或问题进行调查研究,然后把调查结果真实地表述出来的书面报告,是常见的应用文。描述报告结果和数据时,常用一般现在时,人称以第三人称为主。
Imagine & create
二、谋篇布局
调查报告通常包括调查主题、调查信息以及调查结果。根据提示结合图表,把调查的相关信息和结果清楚、条理地表述。
正文可分为三部分:
第一部分:说明调查主题及目的。
第二部分:介绍具体的调查信息(如内容、范围、对象、人数及方式)。
第三部分:描述调查结果。
三、组织语言
你是李华,上周你参加了学校以“你看到饭菜倒掉的感觉如何?”为题举办的调查活动,有200位学生参加了此次调查,请根据所提供的调查数据写一篇调查报告向校英文报投稿。
注意:
1. 词数100左右;
2. 可适当增加细节,以使行文连贯。
Imagine & create
Last week, a survey involving 200 students was carried out in our school on “How do you feel when seeing food being thrown away ” The results are as follows.
The survey shows that 11% of the students don’t pay any attention to food waste. About the same percentage of students feel it’s none of their business when they see someone throwing the food away. 79% of the surveyed students consider it a pity to waste any food.
In my opinion, we students should be more careful when choosing what to eat and how much we can eat. Only in this way can we reduce food waste.
Unit 8
Green Living
A Survey Report
To read and understand a survey report.
To identify the main idea of each paragraph and label it correctly.
To read and understand graphs.
To use expressions relating to quantity.
To write a survey report.(outline)
Teaching Aims
Get to the new words
Perceive & notice
a person who has a position of responsibility in an organization
to keep in mind sth when thinking about sth else
sth which is thrown away after it has been used
a box or a bottle used to put or store sth
a simple drawing or plan that shows exactly where something is, what something looks like, or how something works
container, disposable, take…into account, diagram, official
official
take…into account
disposable
container
diagram
Match the words to the correct meanings.
an amount of something, often expressed as a number out of 100
a light strong material which can be made into different shapes when it is soft
a thick white liquid food, made by adding bacteria to milk, served cold and often flavored with fruit
a system that makes the air in a room or building cooler and drier
to show that a particular situation exists, or that something is likely to be true
air conditioning, plastic, indicate, yoghurt, percentage
percentage
plastic
yoghurt
air conditioning
indicate
n. 居民
You are going to write a survey on environmental protection for the residents in your city or town. What should be included in a survey report
Discuss your ideas in pairs.
关于环境保护的调查
Perceive & notice
Read the text silently on your own. Discuss the two questions in pairs. Underline all the questions asked.
What questions are asked (Para.1)
Is it necessary to help protect environment?
What actions have you taken to protect the environment
Perceive & notice
Read the survey report. Look at the two graphs on P. 40. What are the graphs
The first graph is a pie chart, the second is a bar chart.
Acquire & comb
Get to know how to express numbers
How do you express these numbers
What are the ways in the survey report
Acquire & comb
The percentage of those who felt that they needed to help protect the environment is as high as 96%.
Very few (4% )felt it was not necessary.
回顾:
How do you express these numbers
What are the ways in the survey report
Last August , city officials interviewed about 500 residents to find out....
More than half of those who took part in the survey had done four of the five activities in the past month.
How do you express these numbers
What are the ways in the survey report
Around 90% (88%) had tried to recycle waste , such as glass, metal
and paper; and more than two thirds (70%) had tried to cut back on the use of disposable packaging, such as plastic, honey bottles and butter and yogurt containers. Also the majority of residents (74%)had
cycled or walked.
Unfortunately, not as many (没有多少人) who took part had taken action to save water and energy in their homes. Just under 40% (38%) try to save water when they were washing dishes or taking showers. Just over half ( 51% ) tried to save energy by reducing the use of air conditioning or turning off lights.
Acquire & comb
What are the advantages of the ways the article is presented
Giving numbers and quantity in this way makes a report more interesting and not a mere presentation of numbers
Analyze & judge
Get to know the structure of a survey report
Label ( 贴...) each paragraph of the report with the following headings.
Introduction
Conclusion
Negative findings
Positive findings
Summarize & integrate
a. Introduction
c. Negative findings
b. Conclusion
d. Positive findings
Summarize & integrate
Get to know the structure of a survey report
A Survey Report
Para 1: Introduction
Para 2: Positive findings
Para 3: Negative findings
Para 4: Conclusion
Summarize & integrate
写调查报告时,很重要的是 1.介绍调查的目的、参与人数、整体调查结果2. 描述调查的主要结果及支持数字3.使用数量表达式和适当的图表。 4.总结你的发现并给出建议
(When writing a survey report, it's important to
1. introduce the survey, for example, its purpose, the number of those taking part, the overall findings
2. describe the major findings and supporting figures in the survey
3.use quantity expressions and proper graphs
4. summarize your findings and give recommendations)
Internalize & apply
Use the structure in activity 3, make notes in order to organize the information for your report:
Use the outline of the report on page 40 to organize and use the quantity expressions in the Sentence Builder.
Work only on the outline and not the actual report.
Write an outline for your report based on Activities 3 and 4, and the data on page 41. You can also do a survey online and write a report based on the data you got.
Internalize & apply
Last month, city officials ___________________ ( 496 市民)to find out people's attitudes to using shared bikes and the reasons . Here are the results. As the diagram shows, ____________ ( 70%) of those who took part in the survey have used shared bikes while ________________ (不到三分之一)(30%) haven’t.
interviewed about 500 residents
more than two thirds
less than one third
Internalize & apply
As high as 96% of those who have used shared bikes thought it was convenient to use one.
Nearly 70% thought it was cheap to use shared bikes. Only less than 20% thought using shared bikes was good for reducing pollution. Slightly over 30% thought it was a good form of exercise.
高达96%
接近70%
只有不到20%
略微超过30%
Among those who haven’t used shared bikes, more than two thirds regarded it unsafe. And less than one third of them though it too hot in summer and too cold in winter to ride a bike.
不到三分之一
超过三分之二
To sum up, more than two thirds of those who took part ever used shared bikes, either because of its convenience (convenient) or because of being ( be ) cheap. However, among those who did not use shared bikes, a majority (major) thought they were not safe. This indicates that it is necessary (necessity) for the city government to strengthen (strong) road safety management.The design of shared bikes should pay more attention to its safety (safe) .
总之 总而言之
______________
_____
________
__________
__________
______
Use your outline and the Writing Help to write your first draft.
Think of an appropriate recommendation based on the data you have.
Copy the graphs provided in the correct section of your report by roughly sketching them.
Edit your report in pairs. Then share what you have written in class.
The final stage of writing is editing. Check ideas are clear and sentences are complete.
Exchange your writing with your partner and offer each other suggestions to improve your draft.
Imagine & create
Peer Editing Sheet on page 93. Pay attention to the questions.
Write comments, both positive as well as negative.
Make changes to your drafts.
Prepare a final draft of your work.
一、审题定调
调查报告是针对生活中的某一现象、事情或问题进行调查研究,然后把调查结果真实地表述出来的书面报告,是常见的应用文。描述报告结果和数据时,常用一般现在时,人称以第三人称为主。
Imagine & create
二、谋篇布局
调查报告通常包括调查主题、调查信息以及调查结果。根据提示结合图表,把调查的相关信息和结果清楚、条理地表述。
正文可分为三部分:
第一部分:说明调查主题及目的。
第二部分:介绍具体的调查信息(如内容、范围、对象、人数及方式)。
第三部分:描述调查结果。
三、组织语言
你是李华,上周你参加了学校以“你看到饭菜倒掉的感觉如何?”为题举办的调查活动,有200位学生参加了此次调查,请根据所提供的调查数据写一篇调查报告向校英文报投稿。
注意:
1. 词数100左右;
2. 可适当增加细节,以使行文连贯。
Imagine & create
Last week, a survey involving 200 students was carried out in our school on “How do you feel when seeing food being thrown away ” The results are as follows.
The survey shows that 11% of the students don’t pay any attention to food waste. About the same percentage of students feel it’s none of their business when they see someone throwing the food away. 79% of the surveyed students consider it a pity to waste any food.
In my opinion, we students should be more careful when choosing what to eat and how much we can eat. Only in this way can we reduce food waste.
同课章节目录
- Unit 7 Art
- Lesson 1 Masterpieces
- Lesson 2 Beijing Opera
- Lesson 3 A Musical Genius
- Unit 8 Green living
- Lesson 1 Roots and Shoots
- Lesson 2 Greening the Desert
- Lesson 3 "White Bikes" on the Road
- Unit 9 Learning
- Lesson 1 Active Learning
- Lesson 2 Language Learning Tips
- Lesson 3 The Secrets of Your Memory