牛津上海版(试用本 Module 2 Unit 4 Numbers More practice课件(共15张PPT)
文档属性
| 名称 | 牛津上海版(试用本 Module 2 Unit 4 Numbers More practice课件(共15张PPT) |
|
|
| 格式 | pptx | ||
| 文件大小 | 10.3MB | ||
| 资源类型 | 教案 | ||
| 版本资源 | 牛津上海版(试用本) | ||
| 科目 | 英语 | ||
| 更新时间 | 2023-09-12 00:00:00 | ||
图片预览
文档简介
(共15张PPT)
2
4
Amazing things
Numbers
More practice
*
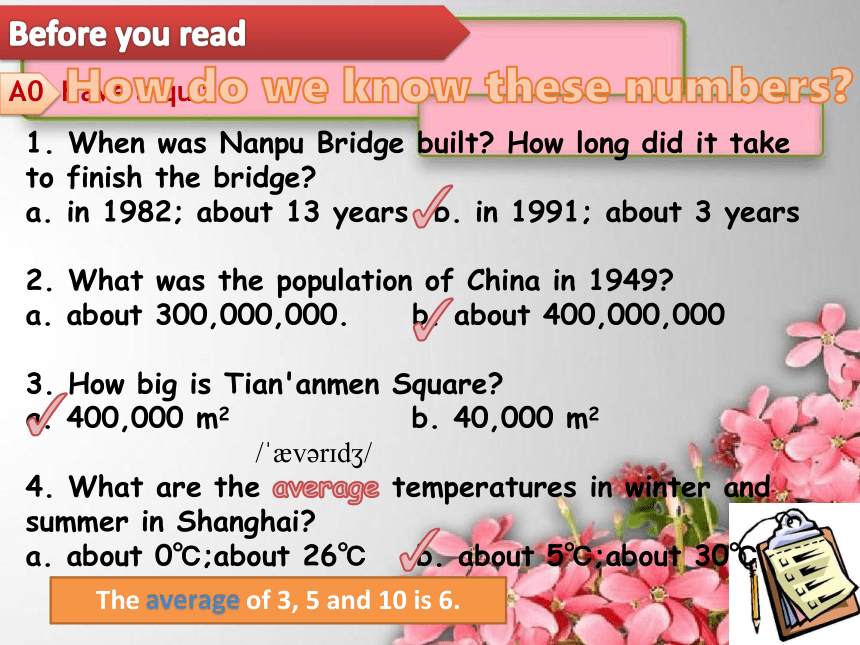
1. When was Nanpu Bridge built How long did it take to finish the bridge
a. in 1982; about 13 years b. in 1991; about 3 years
2. What was the population of China in 1949
a. about 300,000,000. b. about 400,000,000
3. How big is Tian'anmen Square
a. 400,000 m2 b. 40,000 m2
4. What are the average temperatures in winter and summer in Shanghai
a. about 0℃;about 26℃ b. about 5℃;about 30℃
Before you read
A0 Have a quiz
The average of 3, 5 and 10 is 6.
/ v r d /
How do we know these numbers
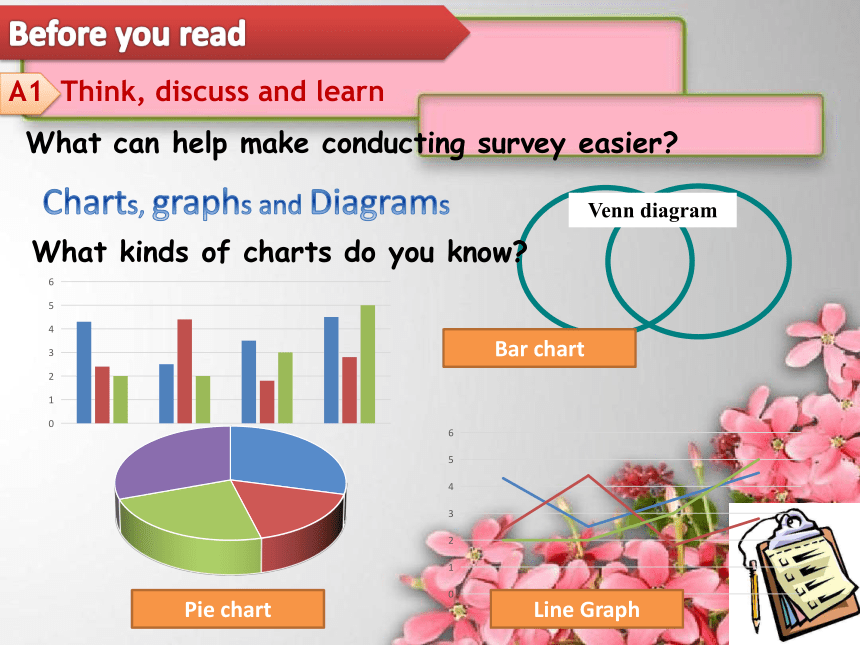
Venn diagram
What can help make conducting survey easier
Before you read
A1 Think, discuss and learn
Charts, graphs and Diagrams
What kinds of charts do you know
Bar chart
Pie chart
Line Graph
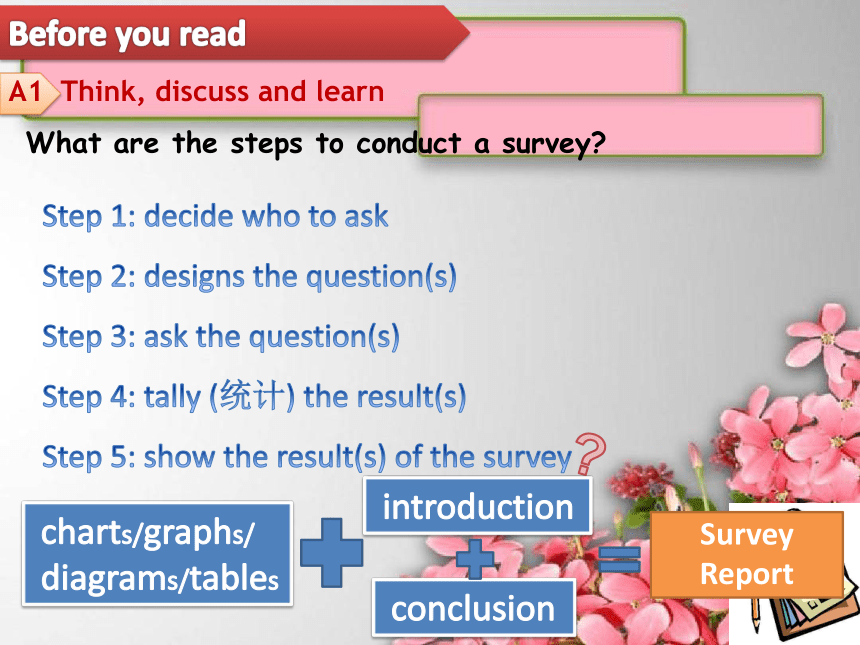
What are the steps to conduct a survey
Before you read
A1 Think, discuss and learn
Step 1: decide who to ask
Step 2: designs the question(s)
Step 3: ask the question(s)
Step 4: tally (统计) the result(s)
Step 5: show the result(s) of the survey
Survey
Report
charts/graphs/
diagrams/tables
introduction
conclusion
Before you read
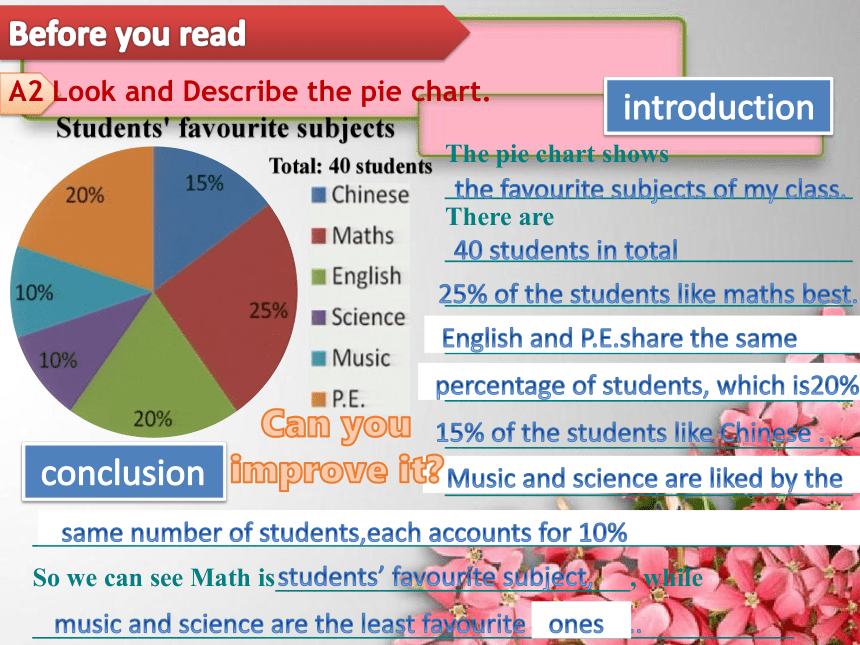
A2 Look and Describe the pie chart.
The pie chart shows _______________________________
There are _______________________________
_______________________________
_______________________________
_______________________________
_______________________________
_______________________________
Students' favourite subjects
Total: 40 students
__________________________________________________________
So we can see Math is___________________________, while
__________________________________________________________
introduction
conclusion
the favourite subjects of my class.
40 students in total
25% of the students like maths best.
20% of the students like English best.
20% of the students like P.E best.
15% of the students like Chinese .
10% of the students like music best.
10% of the students like science best.
English and P.E.share the same
percentage of students, which is20%
Music and science are liked by the
same number of students,each accounts for 10%
Can you improve it
students’ favourite subject,
music and science are the least favourite subjects..
ones
While you read
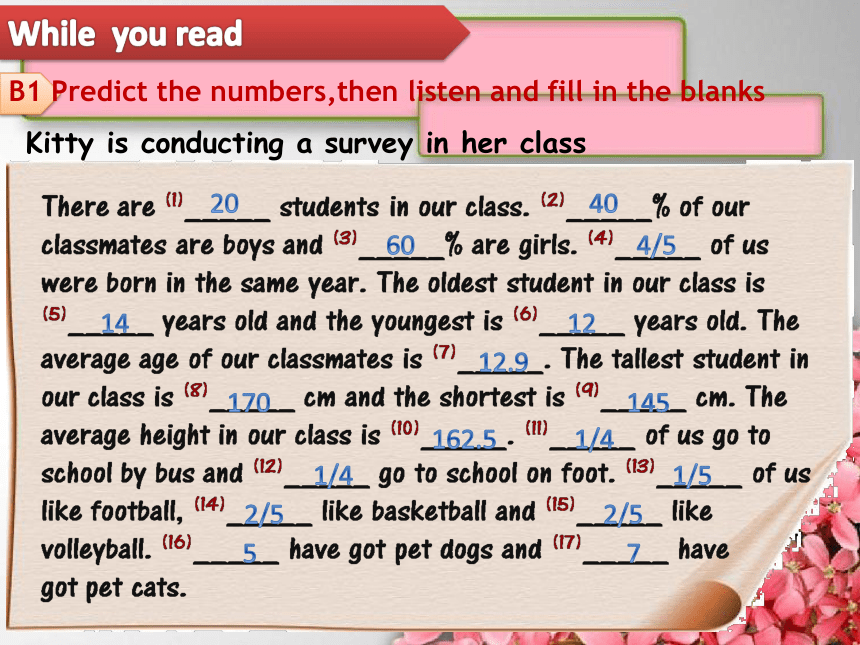
B1 Predict the numbers,then listen and fill in the blanks
20
40
60
4/5
14
12
12.9
170
145
162.5
1/4
1/4
1/5
2/5
2/5
5
7
Kitty is conducting a survey in her class
While you read
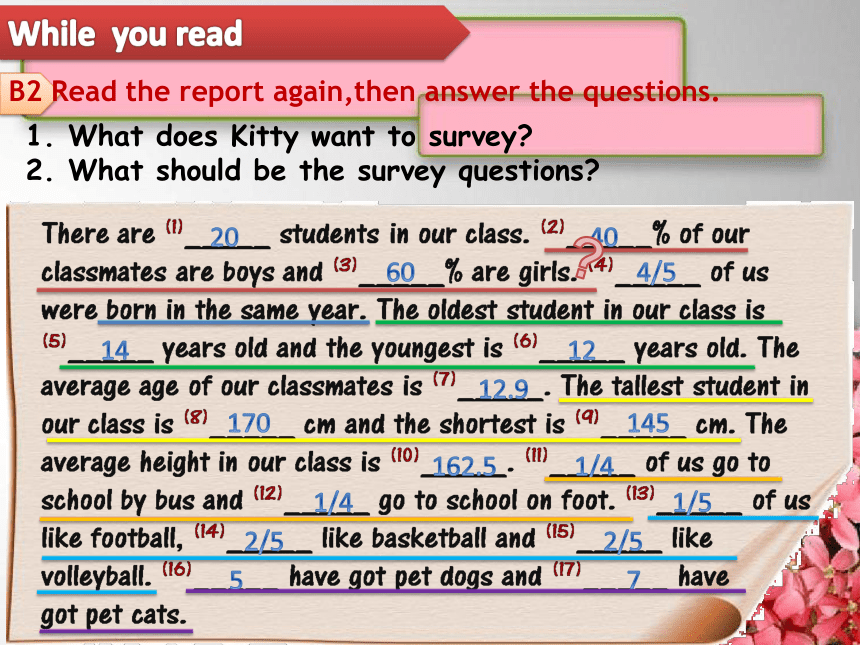
B2 Read the report again,then answer the questions.
20
40
60
4/5
14
12
12.9
170
145
162.5
1/4
1/4
1/5
2/5
2/5
5
7
1. What does Kitty want to survey
2. What should be the survey questions
While you read
B3 Match information with graphs.
By which graph is the data shown
Bar charts
Pie charts
Line graphs
gender
age
height
ways of travelling
favourite ball games
pets
While you read
B4 Tell the information that the graghs show
This is a __________that shows__________
(name of graph) (topic)
Table (height)
Bar chart (age)
Pie chart
(ways of travelling)
While you read
B5 Complete the graph according to the description
__________
______
______
Total: 20 students
___
___
Ways of travelling
by bus
by underground
60%
40%
There are 20 students in our class. 1/4 of us go to school by bus and 1/4 go to school on foot. The restof us go to school by underground.
___
40%
______
on foot
While you read
B6 Complete the graph and make brief report
__________
______
______
Total:_____students
___
___
Gender
boy
girl
20
60%
40%
There are 20 students in our class. 40% of ou classmates are boys and 60% are girls
While you read
B6 Complete the graph and make brief report
Age
_________
__________
4/5 of us were born in the same year. The oldest student in our classis 14 years old and the youngest is 12 years old. The average age ofour classmates is 12.9
Number of students
Age
Name the axes(x&y-axis)
After you read
C0 Brainstorm topics of the survey.
Topic
Siblings
Frequency
of ...
Penfriends
Bedtime
...
After you read
C1 Write questions for the topic.
Topic: Time to go to bed
Step 1: decide who and what to ask Step 2: designs the question(s)
Step 3: ask the question(s) Step 4: tally (统计) the result(s)
Step 5: show the result(s) of the survey
Question: When do you usually go to bed
A. 9.00 p.m.-10.00 p.m.
B. 10.01 p.m.-11.00 p.m.
C. 11.01 p.m.-12.00 a.m.
D. After 12.00 a.m.
After you read
C2 Finish your own survey and write reports
Step 1: decide who and what to ask Step 2: designs the question(s)
Step 3: ask the question(s) Step 4: tally (统计) the result(s)
Step 5: show the result(s) of the survey
Topic
Siblings
Frequency
of ...
Penfriends
Bedtime
...
Survey
Report
charts/graphs/
diagrams/tables
introduction
conclusion
2
4
Amazing things
Numbers
More practice
*
1. When was Nanpu Bridge built How long did it take to finish the bridge
a. in 1982; about 13 years b. in 1991; about 3 years
2. What was the population of China in 1949
a. about 300,000,000. b. about 400,000,000
3. How big is Tian'anmen Square
a. 400,000 m2 b. 40,000 m2
4. What are the average temperatures in winter and summer in Shanghai
a. about 0℃;about 26℃ b. about 5℃;about 30℃
Before you read
A0 Have a quiz
The average of 3, 5 and 10 is 6.
/ v r d /
How do we know these numbers
Venn diagram
What can help make conducting survey easier
Before you read
A1 Think, discuss and learn
Charts, graphs and Diagrams
What kinds of charts do you know
Bar chart
Pie chart
Line Graph
What are the steps to conduct a survey
Before you read
A1 Think, discuss and learn
Step 1: decide who to ask
Step 2: designs the question(s)
Step 3: ask the question(s)
Step 4: tally (统计) the result(s)
Step 5: show the result(s) of the survey
Survey
Report
charts/graphs/
diagrams/tables
introduction
conclusion
Before you read
A2 Look and Describe the pie chart.
The pie chart shows _______________________________
There are _______________________________
_______________________________
_______________________________
_______________________________
_______________________________
_______________________________
Students' favourite subjects
Total: 40 students
__________________________________________________________
So we can see Math is___________________________, while
__________________________________________________________
introduction
conclusion
the favourite subjects of my class.
40 students in total
25% of the students like maths best.
20% of the students like English best.
20% of the students like P.E best.
15% of the students like Chinese .
10% of the students like music best.
10% of the students like science best.
English and P.E.share the same
percentage of students, which is20%
Music and science are liked by the
same number of students,each accounts for 10%
Can you improve it
students’ favourite subject,
music and science are the least favourite subjects..
ones
While you read
B1 Predict the numbers,then listen and fill in the blanks
20
40
60
4/5
14
12
12.9
170
145
162.5
1/4
1/4
1/5
2/5
2/5
5
7
Kitty is conducting a survey in her class
While you read
B2 Read the report again,then answer the questions.
20
40
60
4/5
14
12
12.9
170
145
162.5
1/4
1/4
1/5
2/5
2/5
5
7
1. What does Kitty want to survey
2. What should be the survey questions
While you read
B3 Match information with graphs.
By which graph is the data shown
Bar charts
Pie charts
Line graphs
gender
age
height
ways of travelling
favourite ball games
pets
While you read
B4 Tell the information that the graghs show
This is a __________that shows__________
(name of graph) (topic)
Table (height)
Bar chart (age)
Pie chart
(ways of travelling)
While you read
B5 Complete the graph according to the description
__________
______
______
Total: 20 students
___
___
Ways of travelling
by bus
by underground
60%
40%
There are 20 students in our class. 1/4 of us go to school by bus and 1/4 go to school on foot. The restof us go to school by underground.
___
40%
______
on foot
While you read
B6 Complete the graph and make brief report
__________
______
______
Total:_____students
___
___
Gender
boy
girl
20
60%
40%
There are 20 students in our class. 40% of ou classmates are boys and 60% are girls
While you read
B6 Complete the graph and make brief report
Age
_________
__________
4/5 of us were born in the same year. The oldest student in our classis 14 years old and the youngest is 12 years old. The average age ofour classmates is 12.9
Number of students
Age
Name the axes(x&y-axis)
After you read
C0 Brainstorm topics of the survey.
Topic
Siblings
Frequency
of ...
Penfriends
Bedtime
...
After you read
C1 Write questions for the topic.
Topic: Time to go to bed
Step 1: decide who and what to ask Step 2: designs the question(s)
Step 3: ask the question(s) Step 4: tally (统计) the result(s)
Step 5: show the result(s) of the survey
Question: When do you usually go to bed
A. 9.00 p.m.-10.00 p.m.
B. 10.01 p.m.-11.00 p.m.
C. 11.01 p.m.-12.00 a.m.
D. After 12.00 a.m.
After you read
C2 Finish your own survey and write reports
Step 1: decide who and what to ask Step 2: designs the question(s)
Step 3: ask the question(s) Step 4: tally (统计) the result(s)
Step 5: show the result(s) of the survey
Topic
Siblings
Frequency
of ...
Penfriends
Bedtime
...
Survey
Report
charts/graphs/
diagrams/tables
introduction
conclusion