八年级英语上册Unit2NumbersWriting课件(共16张PPT)沪教版
文档属性
| 名称 | 八年级英语上册Unit2NumbersWriting课件(共16张PPT)沪教版 |  | |
| 格式 | pptx | ||
| 文件大小 | 6.8MB | ||
| 资源类型 | 教案 | ||
| 版本资源 | 牛津深圳版 | ||
| 科目 | 英语 | ||
| 更新时间 | 2025-02-06 10:14:39 | ||
图片预览


文档简介
(共16张PPT)
Unit 2
Numbers
Writing
What’s the line graph about
What does the vertical axis stand for
What does the horizontal axis stand for
How many accidents were there in July
What’s the number of accidents in August
A report with numbers
Look at the line graph and answer the following questions.
Traffic accidents.
The number of accidents.
The month.
208.
234.
Pay attention to new words
traffic n. 交通P28
accident n. (交通)事故P28
traffic accident 交通事故
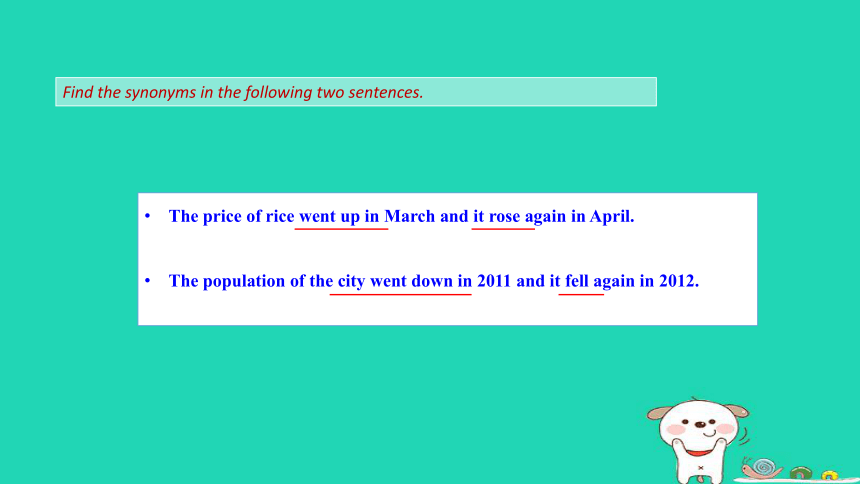
Look at the line graph again and complete the sentences below.
The number of accidents _________ (went up/went down) in October.
The number of accidents ____________ (went up/went down) in November.
went up
went down
Find the synonyms in the following two sentences.
The price of rice went up in March and it rose again in April.
The population of the city went down in 2011 and it fell again in 2012.
The temperature rose to 18℃.
The air conditioner raised the temperature to 18℃.
= go up, increase
= put up, increase
rise (vi.)
raise (vt.)
Read the sentences below. Note the differences between the words in italics.
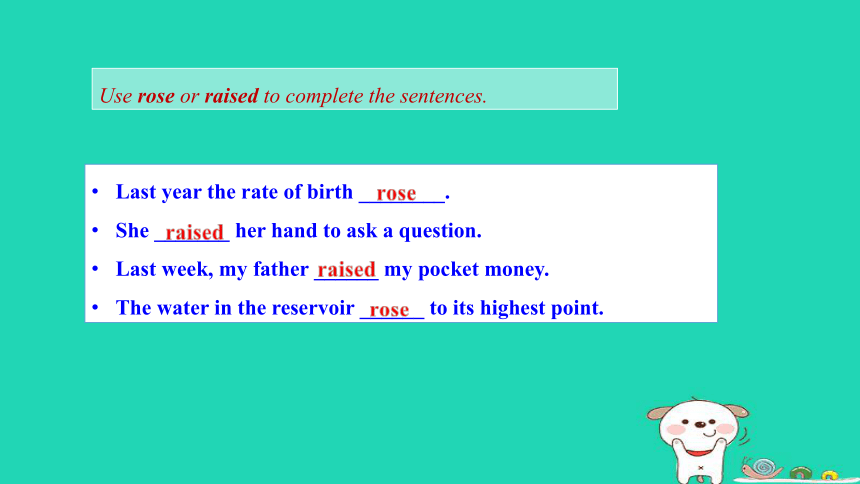
Use rose or raised to complete the sentences.
Last year the rate of birth ________.
She _______ her hand to ask a question.
Last week, my father ______ my pocket money.
The water in the reservoir ______ to its highest point.
rose
raised
raised
rose
A report with numbers
Write the numbers in
figures, not in words.
A May found some figures about traffic accidents in her city. She drew a line graph and wrote a plete the report below.
Traffic accidents (July-November)
The graph shows that there were(1)____ traffic accidents in our city in July. In(2)_______, the number(3) _______ to (4)________ and then(5) ________ to (6)________ in (7)___________. In (8)__________, the number(9)__________ again
to (10)__________. It (11)_________ to (12)_________in (13)____________.
208
August
rose
234
fell
220
September
October
rose
239
fell
224
November
Look at the line graph and complete the table below.
Year 2009 2010 2011 2012
Number
123,000
125,000
120,000
113,000
123,000+2,000
=125,000 (rose)
125,000-5,000
=120,000(fell)
120,000-7,000
=113,000(fell)
123,000
A report with numbers
Write sentences using information from the table and following the example below.
Example:
In 2010, the number rose.
The number was 125,000.
In 2011, the number fell. The number was 120,000.
In 2012, the number fell again. The number was 113,000.
In 2010, the number rose to 125,000.
In 2011, the number fell to 120,000.
In 2012, the number fell again to 113,000.
B Look at the line graph on p. 28 about the number of students at junior high schools in May’s city. Then write a report by following the example in A.
Number of students in junior high schools
The graph shows that there were 123,000 students at junior high schools in May’s city in 2009. In 2010, the number rose to 125,000, and then fell to 120,000 in 2011. In 2012, the number fell again to 113,000.
1,We have learned a report with numbers.
假设你是Cindy,今天你拿到了上周测验的成绩单以及老师给予的评价,请根据以下提示写一篇英语报告。词数70左右,开头已给出,不计入词数。
Name Subject Marks Teachers’ idea
Cindy Chinese 95 hard-working
English 88 good at writing
Maths 52 lazy(懒惰的)
写作技巧
如何写数图表字作文
命题者利用图表设计试题,要求通过观察图表,将数据、文学内容及图表所包含的有效信息进行分析,将它们准确地转化为表意的说明文字,从而得出令人信服的结论。由于图表直观、实用,同时能更好地考查观察能力、分析问题及语言驾驭能力,因此越来越受到中考命题的青睐。图表类书面表达常以数据统计类和比较类两种形式进行考查。
【写作提示】
1 主要人称:第一人称
2 主要时态:一般现在时,一般过去时,一般将来时
3 可用素材:
(1)词汇 finish,quiz,report,the highest marks,
pass,work hard,next,better
(2) 句式 In this report...
try one’s best...
be able to...
