译林牛津版高中英语模块四Unit1 Advertising Skills building 1课件(共29张PPT)
文档属性
| 名称 | 译林牛津版高中英语模块四Unit1 Advertising Skills building 1课件(共29张PPT) |

|
|
| 格式 | zip | ||
| 文件大小 | 478.6KB | ||
| 资源类型 | 教案 | ||
| 版本资源 | 牛津译林版 | ||
| 科目 | 英语 | ||
| 更新时间 | 2019-05-30 00:00:00 | ||
图片预览


文档简介
课件29张PPT。Module4 unit1
Skills building 1:
Listening for statistics and descriptionsAre you good at listening?
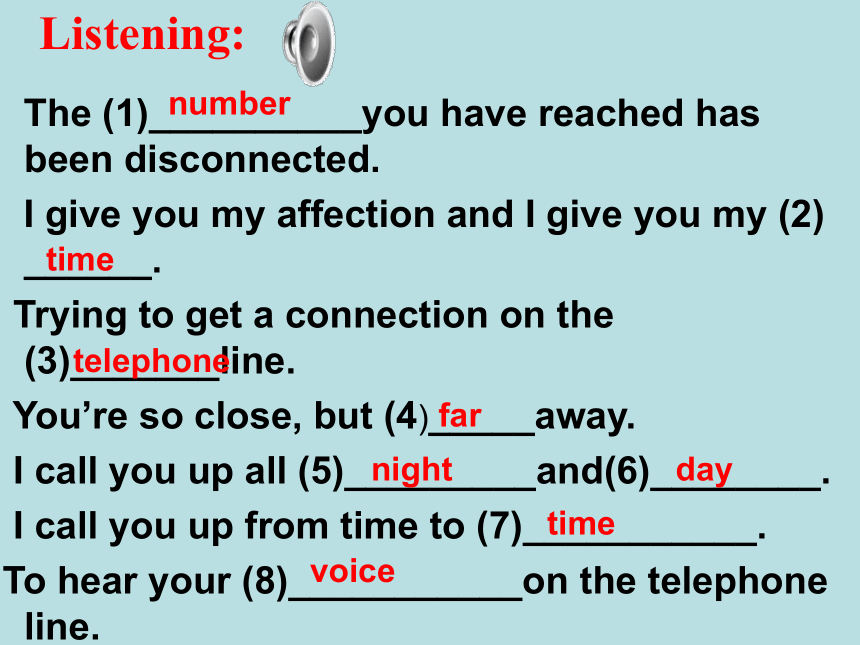
What difficulty do you have in listening?Do you like listen songs? The (1)__________you have reached has been disconnected.
I give you my affection and I give you my (2) ______.
Trying to get a connection on the (3)_______line.
You’re so close, but (4)_____away.
I call you up all (5)_________and(6)________.
I call you up from time to (7)___________.
To hear your (8)___________on the telephone line.numbertimetelephonefardaynighttimevoiceListening:Why is the singer always phoning? A. to listen to the recorded voice
B. to get a connection Before doing some listening ,what can we do to get a good answer?Before doing some listening we can ,
1. read the questions carefully.
2.guess the answers to the questions if possible.
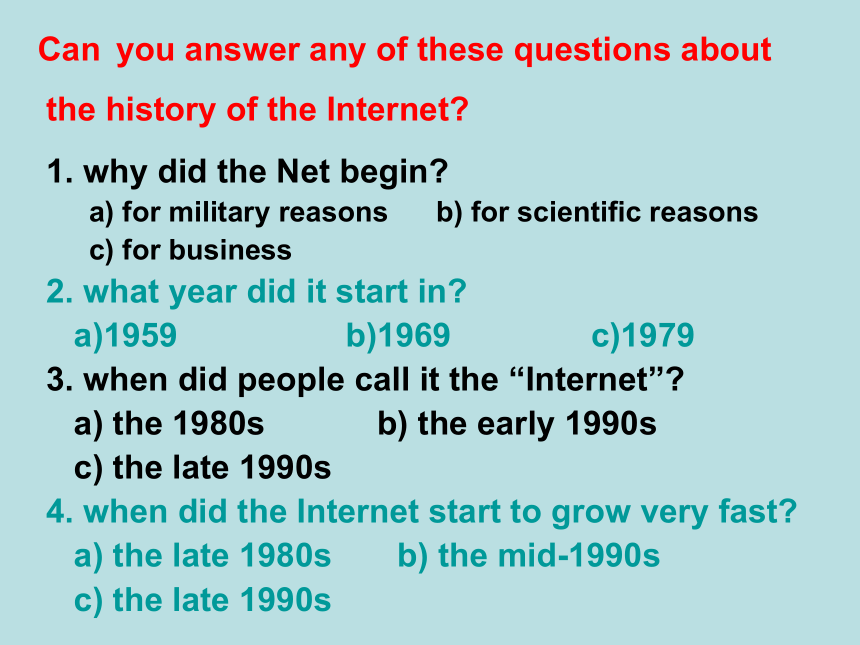
1. why did the Net begin?
a) for military reasons b) for scientific reasons
c) for business
2. what year did it start in?
a)1959 b)1969 c)1979
3. when did people call it the “Internet”?
a) the 1980s b) the early 1990s
c) the late 1990s
4. when did the Internet start to grow very fast?
a) the late 1980s b) the mid-1990s
c) the late 1990sCan you answer any of these questions about
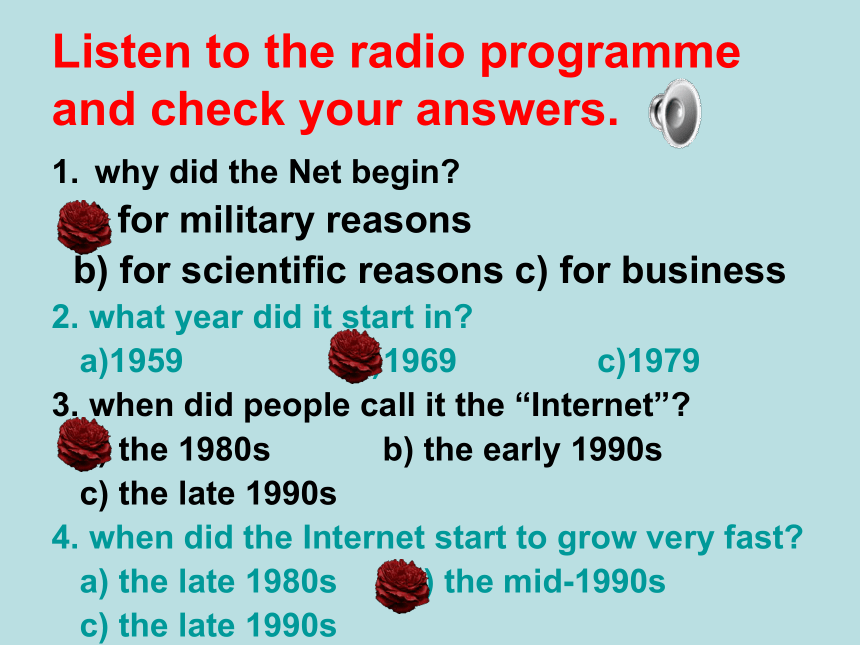
the history of the Internet?Listen to the radio programme and check your answers.why did the Net begin?
a) for military reasons
b) for scientific reasons c) for business
2. what year did it start in?
a)1959 b)1969 c)1979
3. when did people call it the “Internet”?
a) the 1980s b) the early 1990s
c) the late 1990s
4. when did the Internet start to grow very fast?
a) the late 1980s b) the mid-1990s
c) the late 1990s
Listening for statistics and descriptions Statistics: a collection of information shown in numbers.Descriptions: phrases describing statistics.
What numbers are given when you
listen for statistics?
Fractions:
1/5(one fifth) 2/3(two thirds)
3/4 (three quarters)
2 ?(two and one half)
How to read:
2/5 _________ 4 ? ___________
two fifthsfour and three quartersHow to read these statistics:How to read these statistics: decimals:
0.3(zero/nought point three), 6.79(six point seven nine)
How to read:
0.9 ____________________ 2.15________________
zero/nought point ninetwo point one fiveHow to read these statistics:percentages
63%(sixty-three per cent)
45.72%(forty-five point seven two per cent)
How to read 27.35%_____________________________
twenty-seven point three five per centWhat phrases describing statistics should you listen carefully for?
There was an increase of 40 percent.
The price has risen to 25 yuan a kilo.
The price has gone up by 9 dollars a pound.
Four times as many people used our product last year.Describing statistics:an increase ofincrease/rise/go up toincrease/rise/ go up byfour times as many
An
increase
(增加了)(增加到)(增加了)(是……的四倍)Describing statistics:There was a decrease of 42 percent/30 pound.
The figure /amount decreased/ fell by 16.5 percent.A decreasea decrease ofdecrease/fall bydecrease /fall to(下降了)
(下降了)(下降到)
Describing statistics:The maximum speed is 80 kilometres per hour on this road.
The price reached a record high of 150 dollars per kilo.
The sales figures have dropped to their lowest level/point.a limitMaximumreachfall to lowest leveldrop to lowest point(下降到最低点)(最快的,最多的,
最高的,最大极限的)(达到)Describing statistics:There was no change.
The figure/percentage remained/stayed the sameno changeno changeremain/stay the samean average: average price/number…
(没有变化)(保持不变)
Describing statistics:a range:
range between … and …,
range from … to …
(在…和….之间变化)The sales figures range between 40 and 50 percent/from 50 to 60 .1.Number of members two years ago: _______;
last year_______
2.Market share last year:_______; this year______
3.Percentage of students eating lunch in the dining hall
last year: ______ in three years______
4. 3.Percentage of students from our school continuing their education.
last year-at local universities: ___; studying abroad: ____
this year-at local universities: ___; studying abroad: ____
5.Last year: 5,000 museum visitors; out of them: 1,000 young people
This year: ______museum visitors;
out of them : ______young people
1,200 1,30085%65%50%-60%75.5%23.4%11.5%24.5%13.6% 9,000 3,000Listening:Listening:10.512.51524Bar Chart :Discussion:What have you seen in an ad and later
bought?
What’s your favorite advertisement? Why?Homework:Prepare for skills building2 and skills building3.Do some listening on page 96 in workbook.
What difficulty do you have in listening?Do you like listen songs? The (1)__________you have reached has been disconnected.
I give you my affection and I give you my (2) ______.
Trying to get a connection on the (3)_______line.
You’re so close, but (4)_____away.
I call you up all (5)_________and(6)________.
I call you up from time to (7)___________.
To hear your (8)___________on the telephone line.numbertimetelephonefardaynighttimevoiceListening:Why is the singer always phoning? A. to listen to the recorded voice
B. to get a connection Before doing some listening ,what can we do to get a good answer?Before doing some listening we can ,
1. read the questions carefully.
2.guess the answers to the questions if possible.
1. why did the Net begin?
a) for military reasons b) for scientific reasons
c) for business
2. what year did it start in?
a)1959 b)1969 c)1979
3. when did people call it the “Internet”?
a) the 1980s b) the early 1990s
c) the late 1990s
4. when did the Internet start to grow very fast?
a) the late 1980s b) the mid-1990s
c) the late 1990sCan you answer any of these questions about
the history of the Internet?Listen to the radio programme and check your answers.why did the Net begin?
a) for military reasons
b) for scientific reasons c) for business
2. what year did it start in?
a)1959 b)1969 c)1979
3. when did people call it the “Internet”?
a) the 1980s b) the early 1990s
c) the late 1990s
4. when did the Internet start to grow very fast?
a) the late 1980s b) the mid-1990s
c) the late 1990s
Listening for statistics and descriptions Statistics: a collection of information shown in numbers.Descriptions: phrases describing statistics.
What numbers are given when you
listen for statistics?
Fractions:
1/5(one fifth) 2/3(two thirds)
3/4 (three quarters)
2 ?(two and one half)
How to read:
2/5 _________ 4 ? ___________
two fifthsfour and three quartersHow to read these statistics:How to read these statistics: decimals:
0.3(zero/nought point three), 6.79(six point seven nine)
How to read:
0.9 ____________________ 2.15________________
zero/nought point ninetwo point one fiveHow to read these statistics:percentages
63%(sixty-three per cent)
45.72%(forty-five point seven two per cent)
How to read 27.35%_____________________________
twenty-seven point three five per centWhat phrases describing statistics should you listen carefully for?
There was an increase of 40 percent.
The price has risen to 25 yuan a kilo.
The price has gone up by 9 dollars a pound.
Four times as many people used our product last year.Describing statistics:an increase ofincrease/rise/go up toincrease/rise/ go up byfour times as many
An
increase
(增加了)(增加到)(增加了)(是……的四倍)Describing statistics:There was a decrease of 42 percent/30 pound.
The figure /amount decreased/ fell by 16.5 percent.A decreasea decrease ofdecrease/fall bydecrease /fall to(下降了)
(下降了)(下降到)
Describing statistics:The maximum speed is 80 kilometres per hour on this road.
The price reached a record high of 150 dollars per kilo.
The sales figures have dropped to their lowest level/point.a limitMaximumreachfall to lowest leveldrop to lowest point(下降到最低点)(最快的,最多的,
最高的,最大极限的)(达到)Describing statistics:There was no change.
The figure/percentage remained/stayed the sameno changeno changeremain/stay the samean average: average price/number…
(没有变化)(保持不变)
Describing statistics:a range:
range between … and …,
range from … to …
(在…和….之间变化)The sales figures range between 40 and 50 percent/from 50 to 60 .1.Number of members two years ago: _______;
last year_______
2.Market share last year:_______; this year______
3.Percentage of students eating lunch in the dining hall
last year: ______ in three years______
4. 3.Percentage of students from our school continuing their education.
last year-at local universities: ___; studying abroad: ____
this year-at local universities: ___; studying abroad: ____
5.Last year: 5,000 museum visitors; out of them: 1,000 young people
This year: ______museum visitors;
out of them : ______young people
1,200 1,30085%65%50%-60%75.5%23.4%11.5%24.5%13.6% 9,000 3,000Listening:Listening:10.512.51524Bar Chart :Discussion:What have you seen in an ad and later
bought?
What’s your favorite advertisement? Why?Homework:Prepare for skills building2 and skills building3.Do some listening on page 96 in workbook.